
The results of the first Berlin Salary Trends survey are in. We collected 1,061 responses, significantly more than expected. Thanks to everyone contributing data and supporting my guerilla marketing one way or another! This was a lot of work, much more than I expected.
But, this is only the beginning.
GET REMINDED ABOUT THE NEXT SURVEY by submitting your e-mail
🙇🏻 Special thanks goes to: Akmal for his help with my Jupyter notebook and Navid for implementing the dashboard. For the explanation of the dashboard, jump here.
If you would like to make sure to participate in the next survey, you can leave your e-mail here or even better; you can subscribe to my Berlin and careers-related newsletter FOR FREE:
It’s almost impossible to produce all the relevant charts, so we created a dashboard; this way, you can explore most of the data yourself. I am excited to hear your feedback and suggestions for improvements. #berlinsalarytrends
Please remember that this is a hobby project. I hope it helps, and see you soon! 👋
Last report update: 24.7.2023 (added a TL;DR chapter)
next updates: adding Total comp charts, Code Interpreter test, add the median incomes per citizenship group
What’s inside
TL;DR: Average and median salaries in Berlin for selected roles
Average and median salaries in June 2023 in Berlin:
- Solution Architects average salary €90,667 and median €93,000
- Senior Software Engineers average salary €90,318 and median €88,000
- Software Engineers average salary €75,400 and median €68,500
- Senior Data Scientists average salary €95,800 and median €97,000
- Data Scientists average salary €71,400 and median €62,500
- Senior Data Engineer average salary €87,600 and median €84,000
- Data Engineers average salary €65,900 and median €65,000
- UX Designer average salary €63,926 and median €66,000
- Agile Coaches average salary €78,700 and median €76,000
- Data Analysts average salary €60,300 and median €60,000
- Architects average salary €43,000 and median €48,000
- Senior Product Managers average salary €95,200 and median €87,500
- Product Managers average salary €74,700 and median €70,000
- Project Managers average salary €66,777 and median €62,500
You can also filter the data by categories, for example:
- Team Leads (managing small team) average salary €73,856 and median €72,000
- Managers (manages team) average salary €84,773 and median €90,000
- Women average salary €63,084 and median €57,500
- Men average salary €77,506 and median €73,500
This data is from the dashboard. Try different roles and filters yourself.
General overview
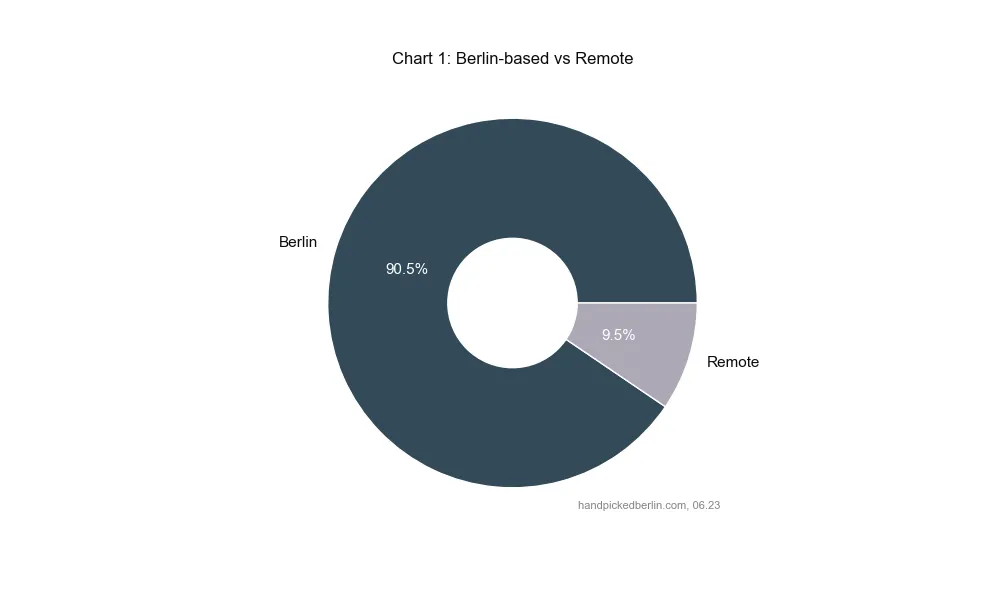
Out of 1,061 responses, I removed eight entries because the data looked extremely strange. We also had 83 entries of people who do not live or work remotely in Berlin; this leaves us with 970 valid entries. The survey was available in German (183 responses) and English (878).
Most respondents (878) were based in Berlin, while 92 worked remotely for Berlin-based organisations.
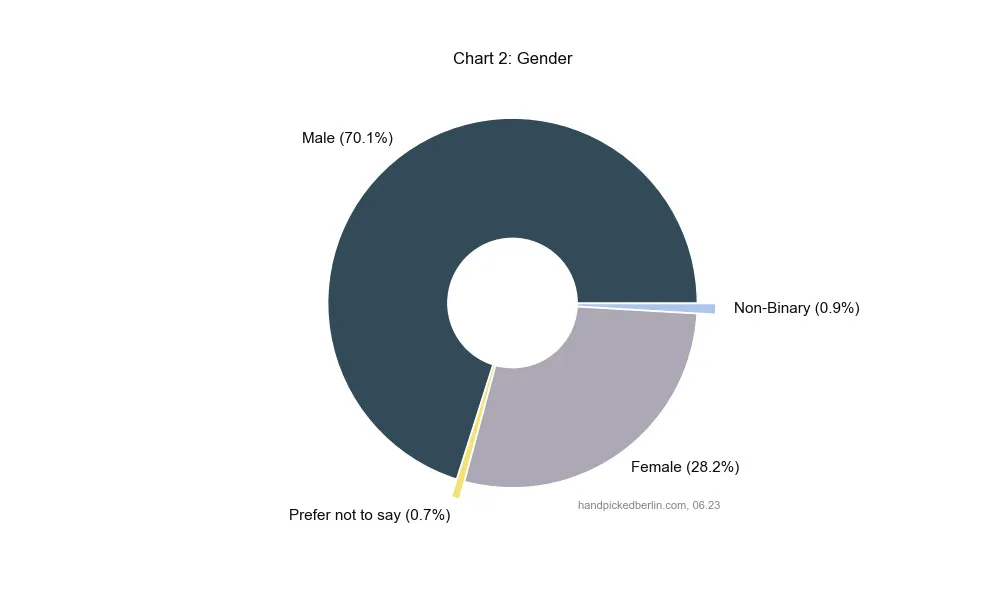
Men were overrepresented; this has to do with the tech bias of my distribution channels, especially on tech-oriented subreddits.
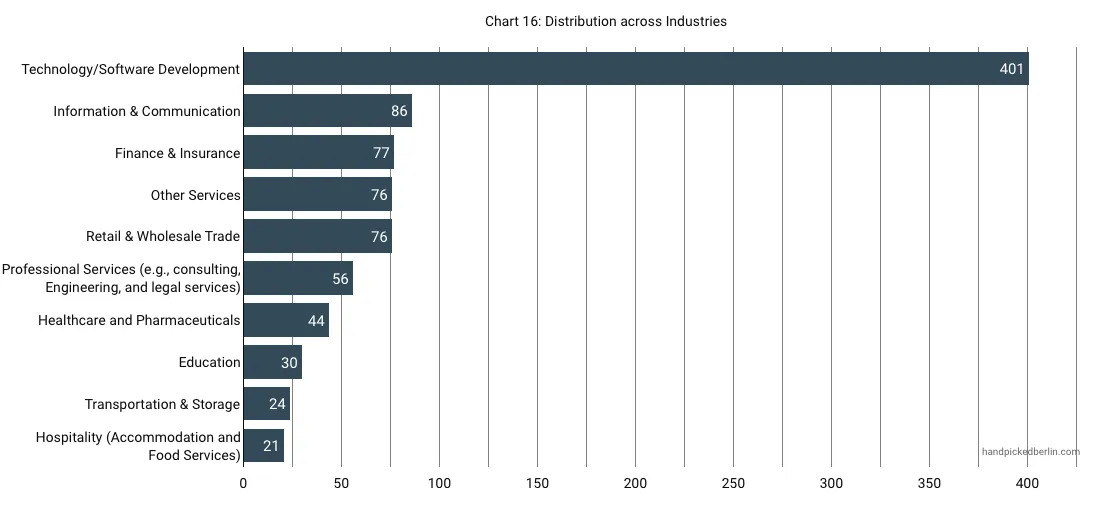
Online someone correctly told me off with “harter Bias,” and yes, the bias is hard. That’s most apparent in the distribution across industries where Tech & Software was in a strong lead, followed by Information & Communication, Finance & Insurance, Retail & Wholesale and others.
But still, better having skewed than no data?
Demographic details
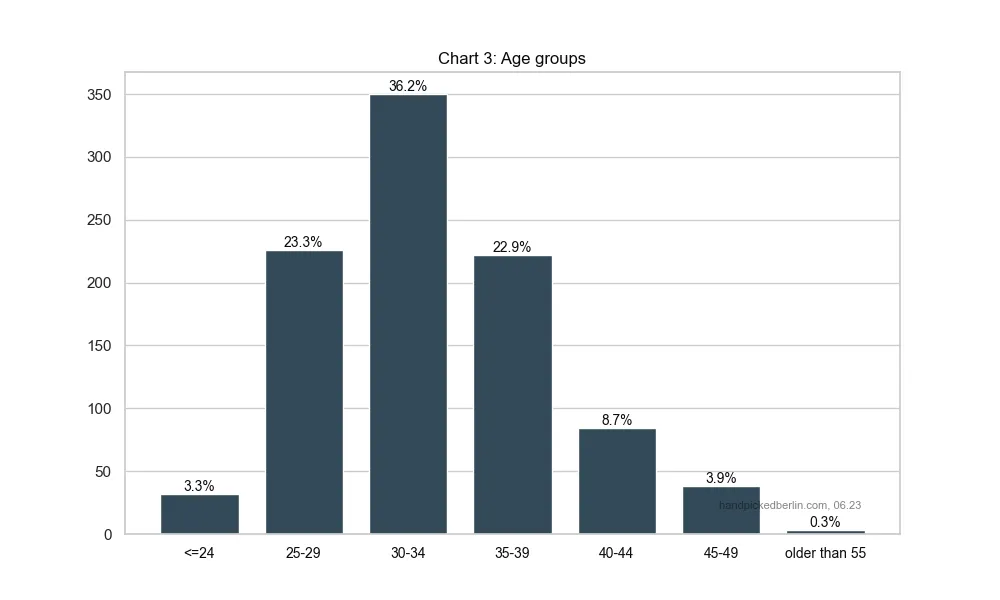
In terms of age, more than 80% of respondents were between 25 and 39. This, again, is related to my guerilla marketing distribution channels. I wish we had higher numbers of more experienced people, but hey, we’ll be growing up together!
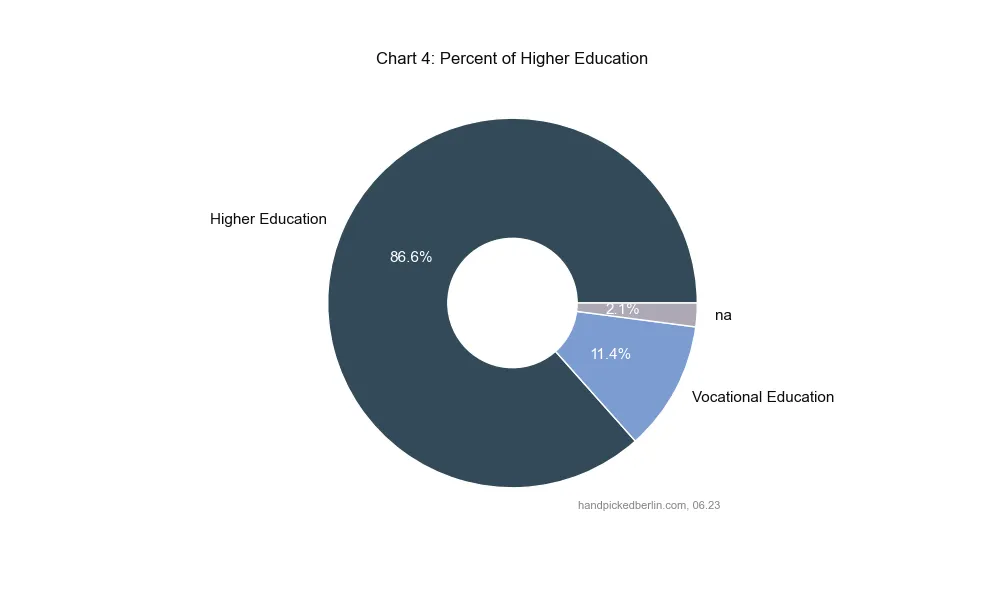
Over 85% of respondents have completed higher education (Bachelor and upwards):
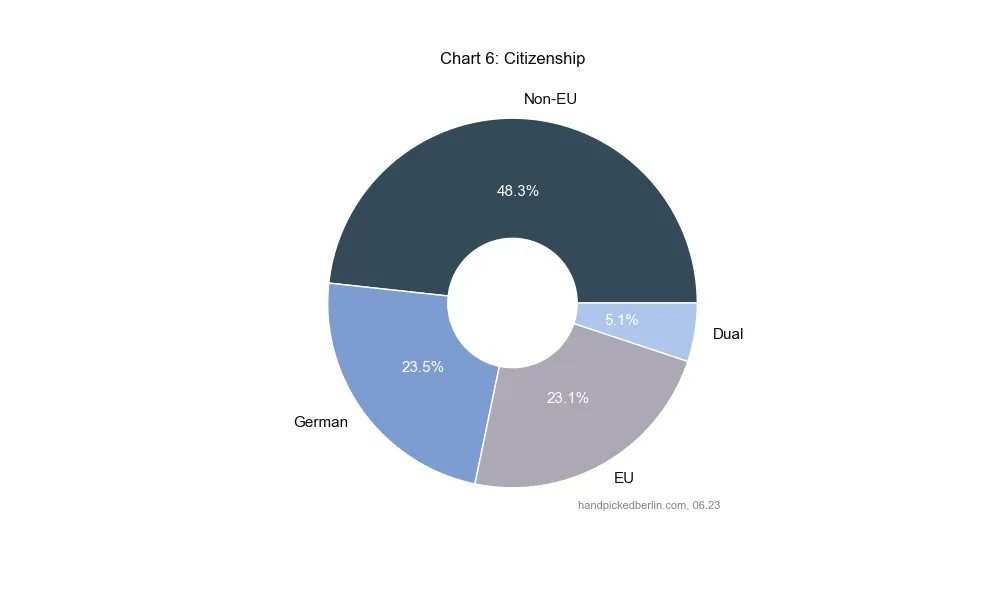
Berlin is in Germany, but my newsletter is in English, and it shows. We only had 275 respondents with German passports (including dual combinations).
Companies and Experience
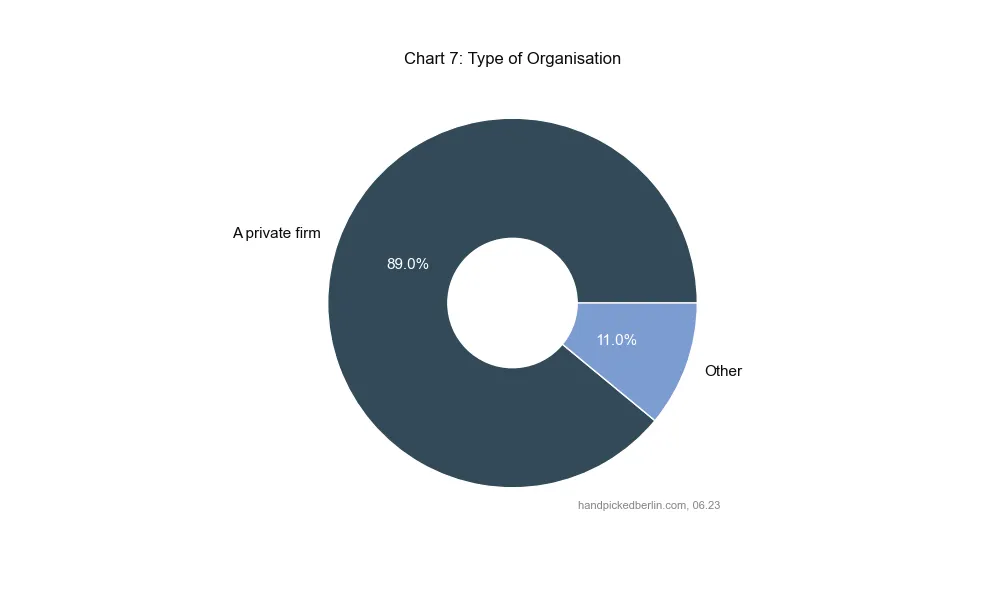
Most respondents work in private firms; the rest (government, NGOs, public sector, freelancers etc.) totalled 11%. It is unclear how many respondents worked in startups: maybe a possible addition next year?
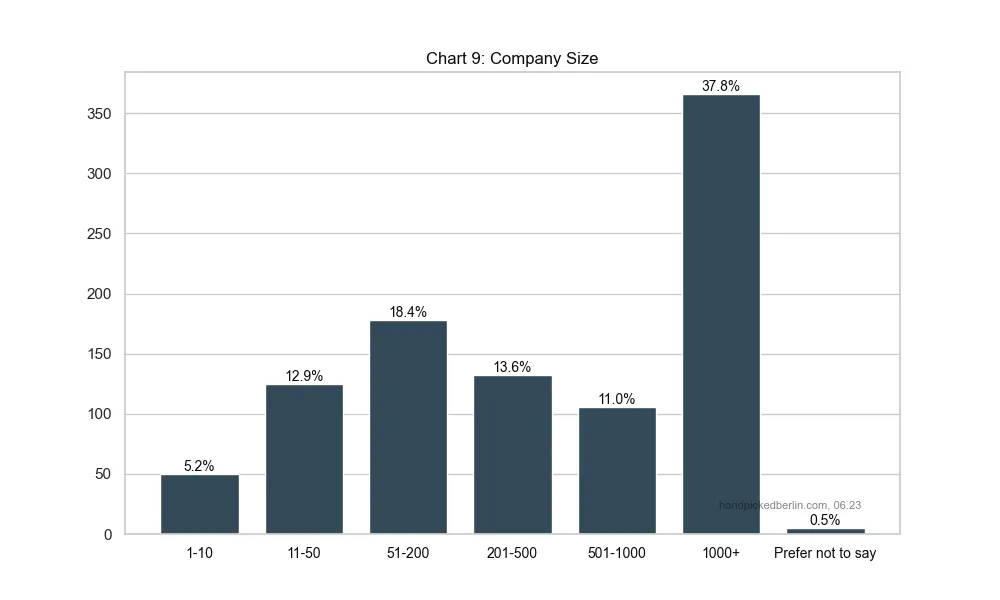
Berlin is not a big industrial powerhouse: Over 60% of respondents were from smaller companies.
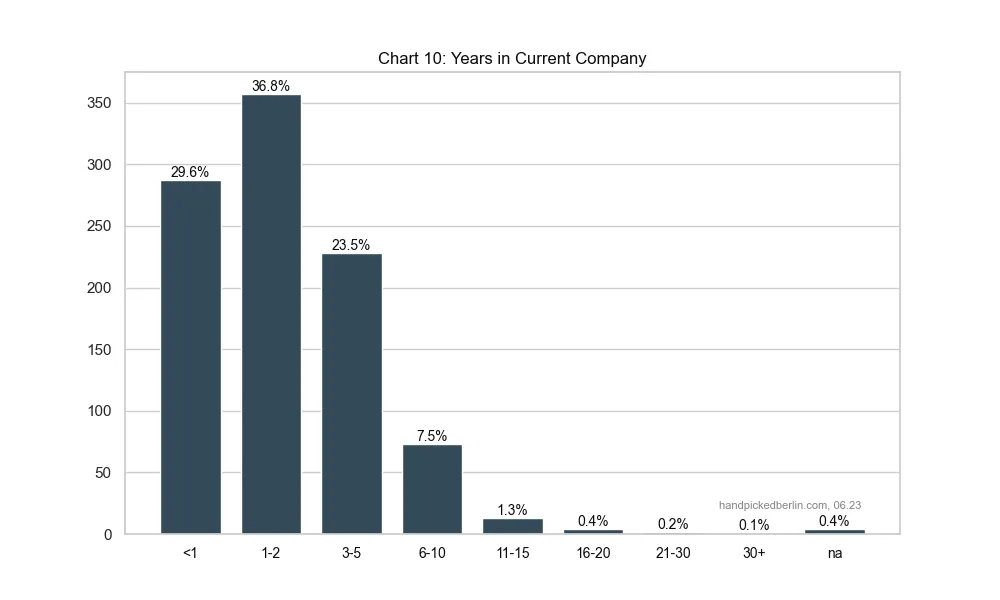
Over 65% have been in their current company only for up to 2 years. “How many different companies have you worked for? may also make sense as a data point in the future.
Roles and experience
Cleaning roles and grouping roles is hard work. For example, a generous engineering filter will reach 376 predominantly Software Engineers. I also found 63 people trying to herd cats: Project and Product Managers. Compare this with ten Architects, eight Working and two PhD Students. We also had plenty of interesting outliers: Musicians, Artists, and Tour Guides.
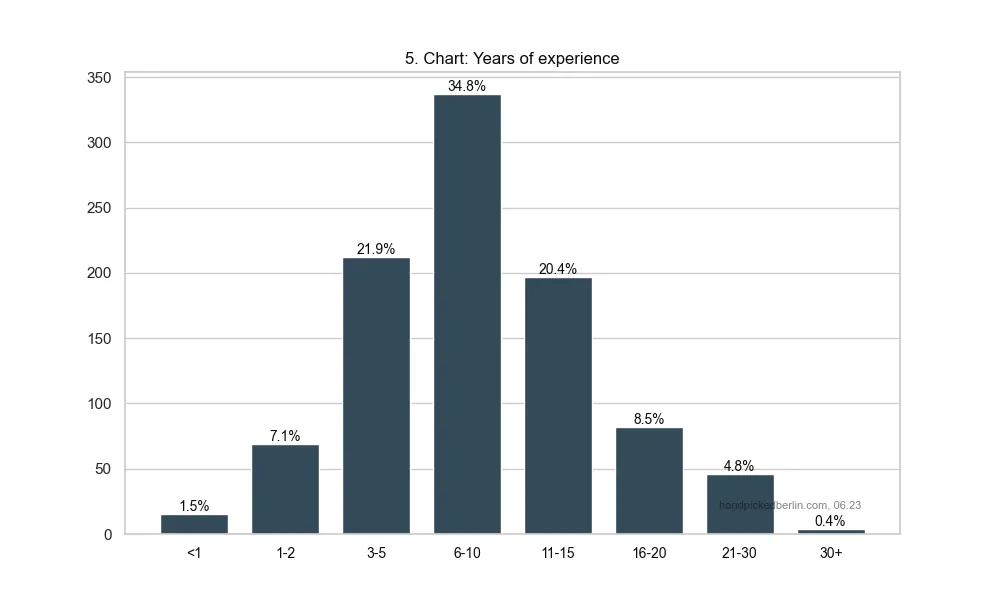
Let’s start with an easy one: total years of experience. Distribution correlates to age, and we did not have many newbies:
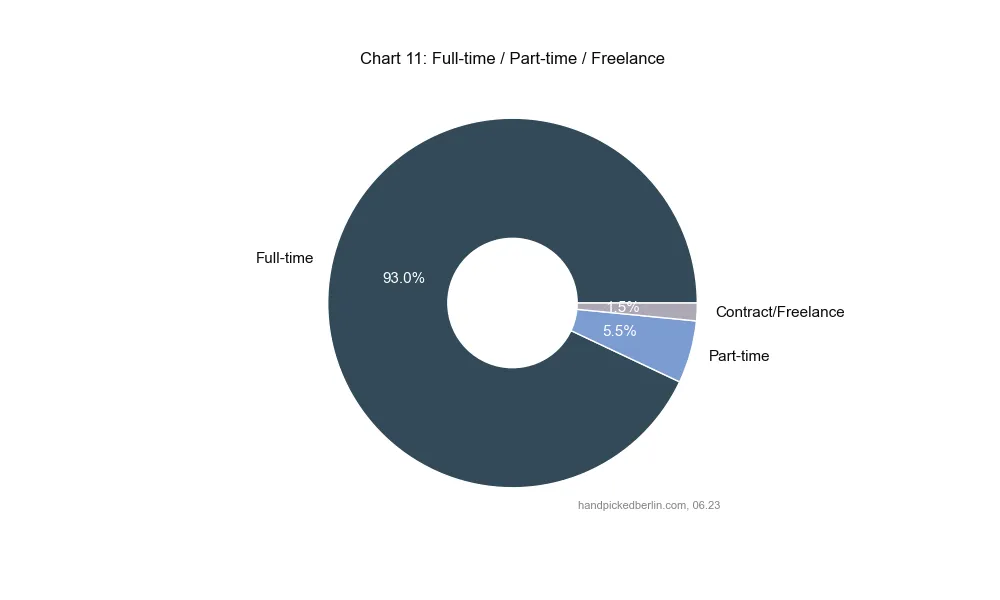
Fifteen freelancers were in the minority: most respondents worked full-time (93.0%):
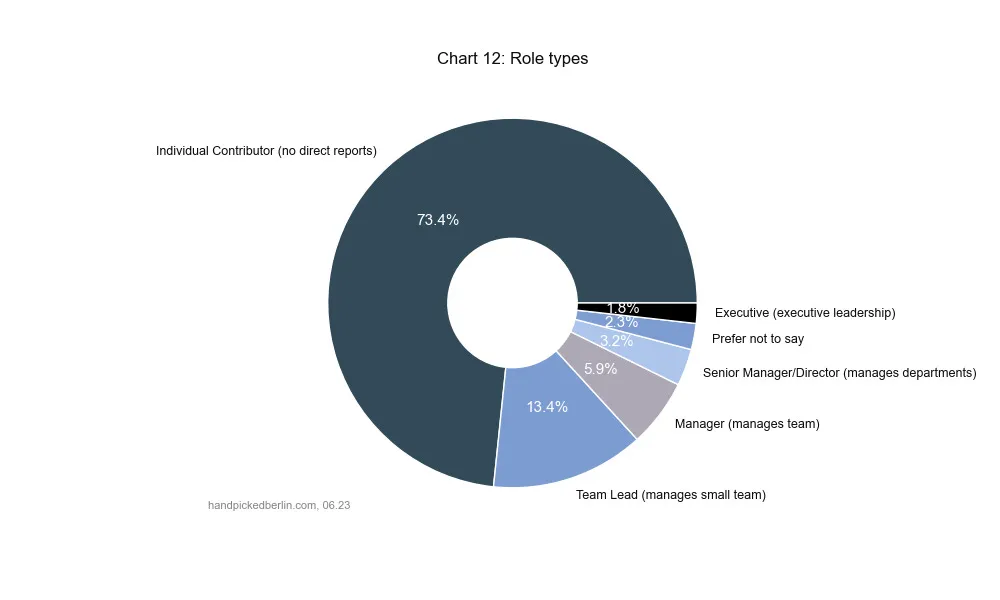
If we were an organisation, we would have too many managers or leaders for my taste: 25 managers for 73 employees.
At last! Berlin salaries!
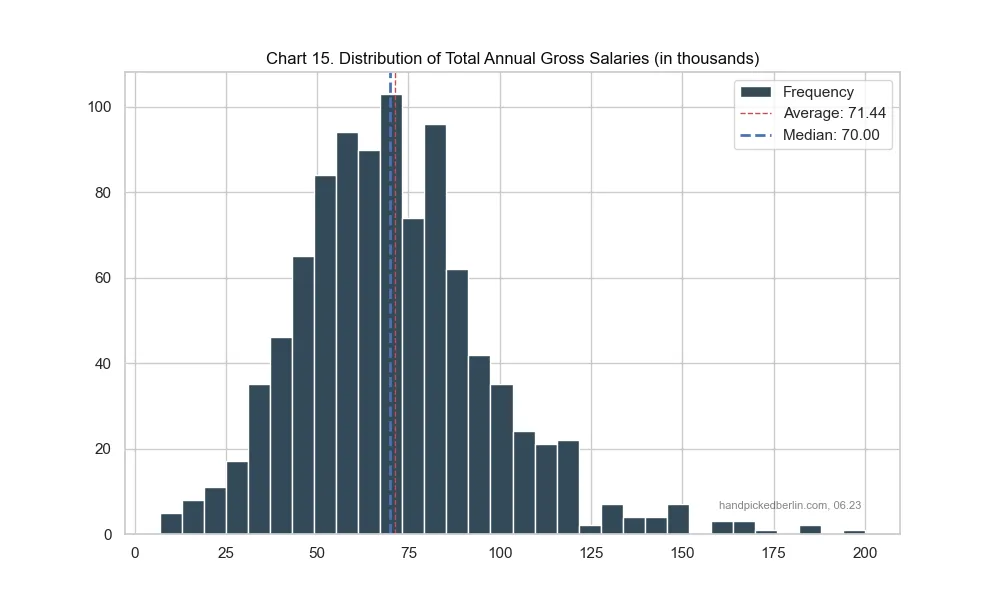
The average total annual gross salary among all valid respondents is €71,470, which is, hmm, not bad at all? The median is €70,000.
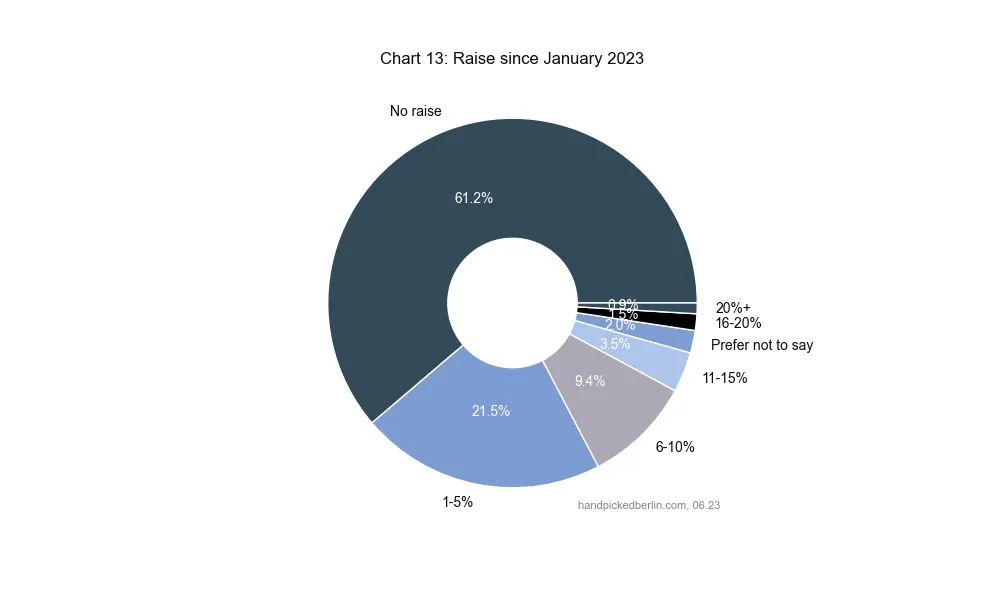
A good third of respondents already received a raise in the last six months:
Only 25% of employees could count on a performance bonus. Almost 20% of the ones with bonuses also received an equity package.
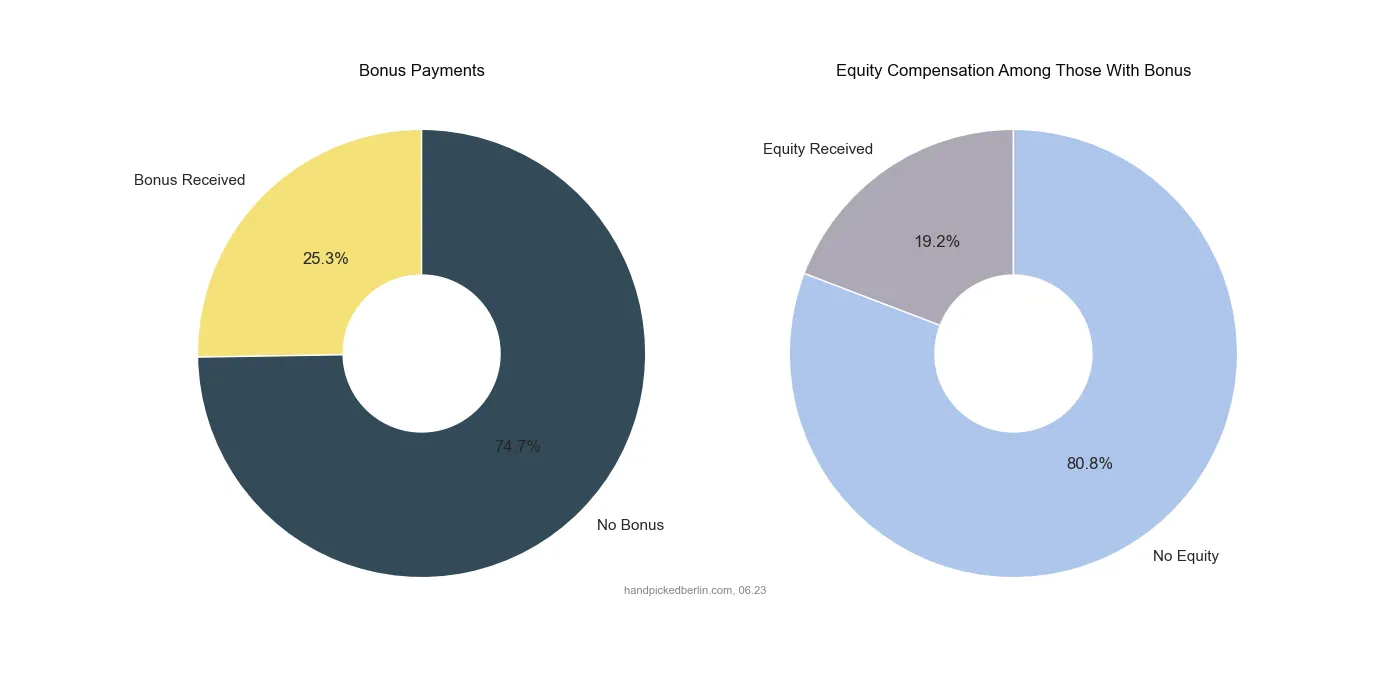
Equity sounds nice, but it comes with conditions of vesting and is, by some, considered “paper money”, so I decided to consider Total Annual Gross Salary (before tax and deductions) in the rest of the charts.
Before you dig into the dashboard, check this histogram for orientation where you stand:
Total annual gross salary vs …
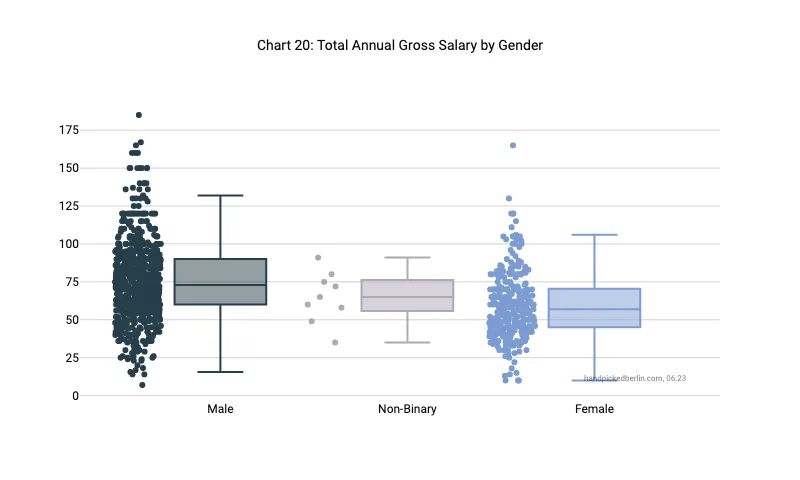
TL;DR: box charts are f**king amazing.
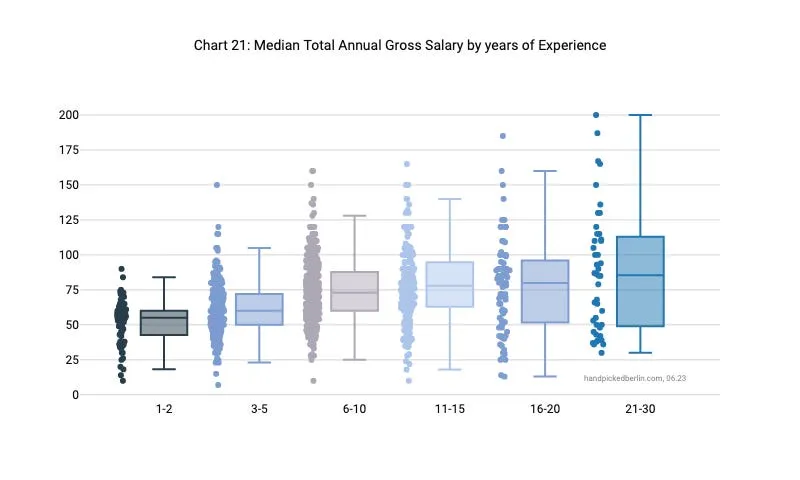
We used box charts because they are great for showing the distribution of salaries across different groups. They use a quartile, a box and ‘whiskers’. The box represents 50% of the data (25th to 75th percentile), and the line inside indicates the median (a middle value separating the higher and lower half). Whiskers indicate minimum and maximum values within the calculated range. Data points outside the range are considered outliers. All charts have trimmed outliers (0.1/0.9) and a limit of 200k.
Data shows what everyone knew already—men get paid more. But I haven’t had time to do further analysis here: the next step would be to control for industry, age and experience.
Similarly, you don’t need to be Sherlock Holmes to understand that the longer you work, the more you’ll bring home. You can also see that the variability increases with time:
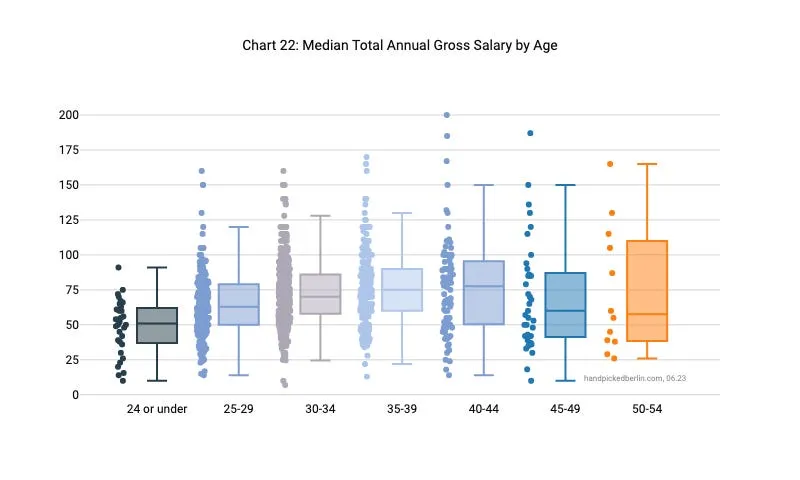
You can expect to have your best years from 40 onwards:
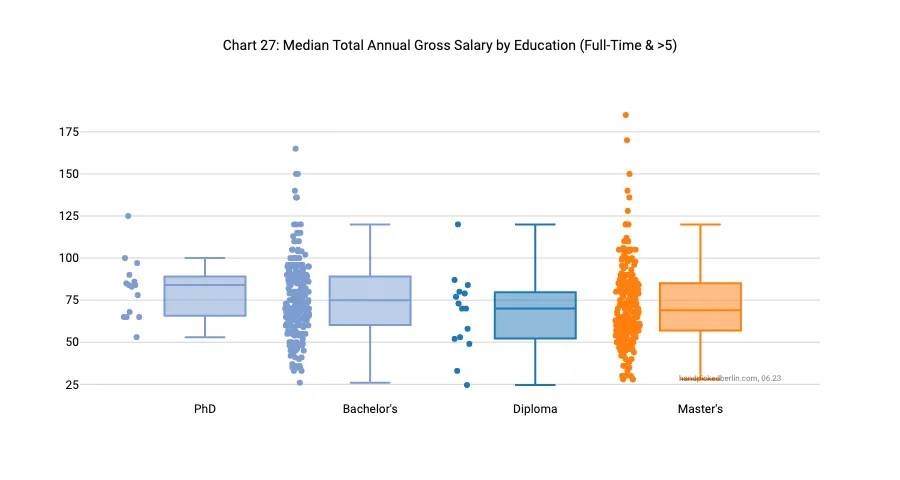
When we isolate higher education and simplify it extremely, a Bachelor’s seems the best business case if you want to optimise for money, providing the biggest pay for the least amount of studies. Could it be related to bachelors having more years of work experience than others who studied longer?
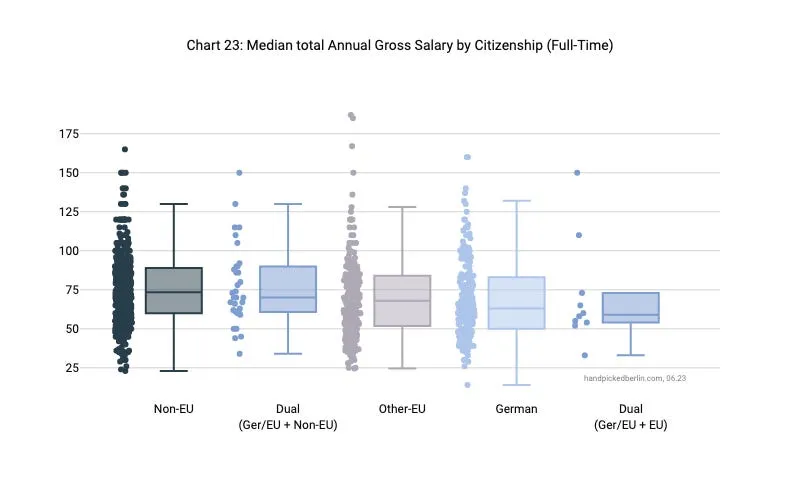
How about your passport? The data was somewhat surprising: Non-EU countries lead with the highest median, while Germany had the greatest variability.
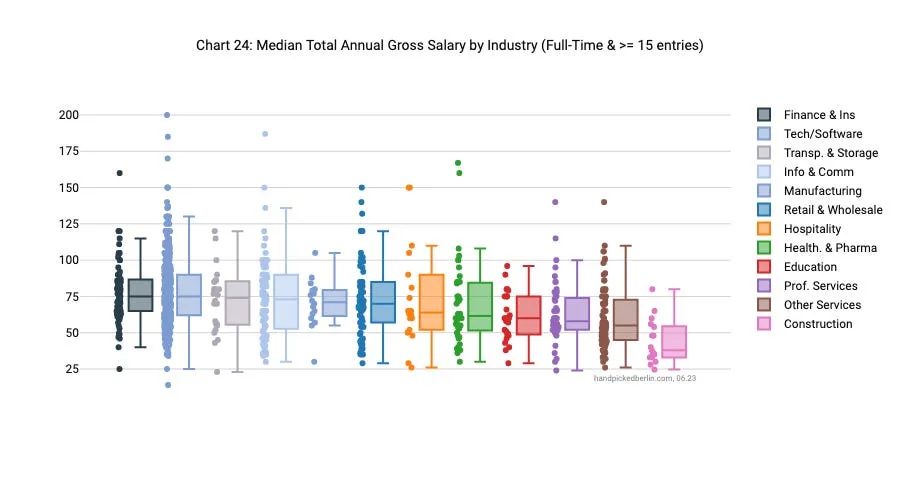
And industries? The chart is crowded, but you will still clearly recognise the most paid industries: Finance/Insurance & Tech/Software, closely followed by Transportation & Storage and Information & Communication.
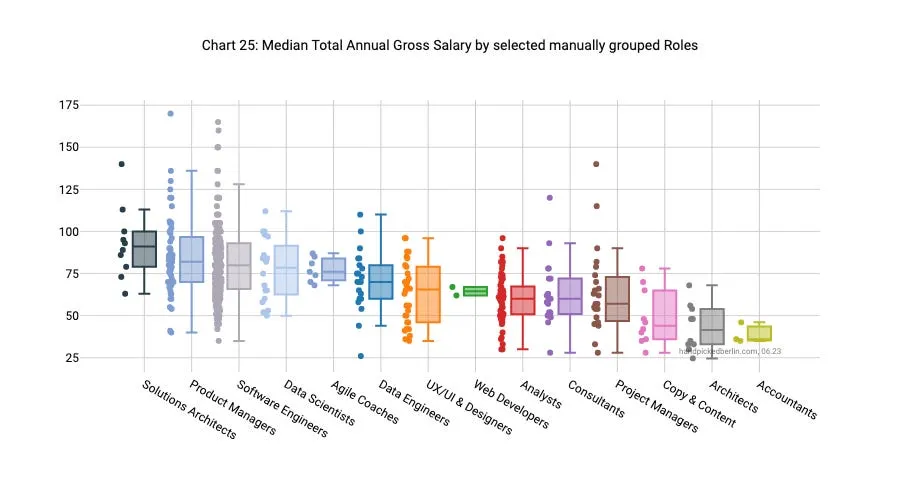
I already mentioned the pain of grouping roles, but here we go. I filtered the data as best as I could, and it is clear that a very distinct group of Solutions Architects were paid the best. I was positively surprised by the Product Managers: compared with the comparably much worse situation of Project Managers. Employers of Architects have it easy: a big passion means a big supply, which lowers their pay. Web Designers are victims of my filters because, surely, some are hiding in Frontend Engineers (grouped under Software Engineers).
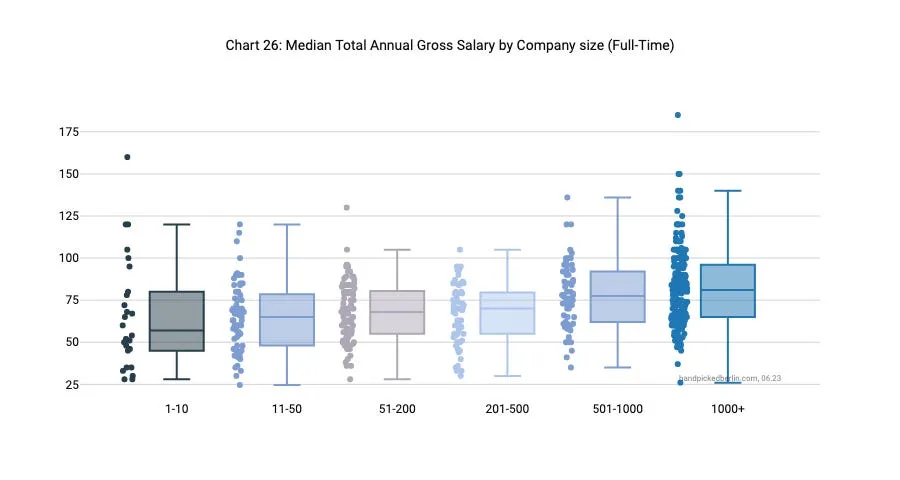
How about size? Bigger companies pay more. And this clearly shows when looking at the next chart:
And that was it from my side.
“Hey, what about…”
Yes! You’re right; plenty of other charts could also be interesting. You can also contribute because the cleaned data will be published in CSV format. It has been years since I studied statistics… and don’t even get me started on Python. 😅
At the time of this writing, I still plan to add a couple of charts based on reader feedback:
- total compensation vs total annual gross compensation (box charts comparisons)
If you have another suggestion or plan to do additional analysis, please let me know: I would love to include it or link it to the Resources section.
Do you want to make sure to participate next year? Drop your e-mail here.
😎 How do you use this data?
It would be tempting to look at some numbers and go to your boss or HR and say, “See, THIS is what the benchmark is!” It’s more complicated than that, as this data does not account for performance and plenty of other factors.
So, use it as an orientation only, and please, when comparing yourself:
- consider years of experience and age brackets (35 and 39 is a big difference),
- take industry, years in the role and the actual role (team leads, managers etc.) into account,
- note that I adapted some really specific roles as described in the appendix and that many roles aren’t really representative because of low number of submissions,
- use common sense, and be kind to other people.
Thank you so much! ❤️
🧑🏻💻 Dashboard: explore the data yourself
The dashboard is built in Looker: I designed it and Navid implemented the logic; let’s see how it performs. Suggestions/tips are welcome.
It seems simple enough:
- whenever you type something in, press ENTER.
- Percentile reacts to a Total Gross Annual salary number.
- The average salary per 40h week takes shorter work weeks into account.
If the dashboard refuses to load, refresh or come back later, it sometimes needs time.
Did you like it? Share this report or ask a question on Twitter or LinkedIn with #berlinsalarytrends
👋 Thanks! I hope you enjoyed this report, and don’t forget to give feedback! Contact me here.
Resources & Media
- GitHub repository
- r/berlin release thread
- 20percent.berlin - #196: Pool IDs, Tesla expanding, Social workers
- Tech.eu - A survey of Berlin’s thriving tech scene sheds light on average salaries
Appendix: On bias, data cleaning and usage
In case of questions, please get in touch with me here. Please also check the GitHub chapter on license and using the survey data.
This was the first survey, hopefully of many. I wish we had a more diverse dataset, but it is what it is. On to a few comments.
- Bias. I am unsure if avoiding it with an anonymous ONLINE survey is even possible. Many of the respondents were highly educated tech workers. In Berlin, according to the Office for Statistics Berlin-Brandenburg (🇩🇪), you are considered wealthy if your monthly net is at least €3,803. In 2022, nearly 9% of Berliners met this threshold. At €70k median, half of the respondents land only €300 under this threshold at Steuerklasse I.
- Promotion. I promoted the survey everywhere I could, mostly through my Handpicked Berlin newsletter and on Twitter, Reddit, Facebook and Instagram (with a small amount of paid ads). I also asked for help everywhere I could.
- Responses. The data is self-reported, and I live with the assumption that not many people take the time to go and lie in a survey. Some charts are without “na” or “prefer not to say” responses. I have also cleaned up typos and taken other measures to improve data quality.
The survey was open for responses in June 2023.
Mandatory fields were:
- Are you currently employed in Berlin or by a Berlin-based organization?
- Gender
- Age
- Type of organisation
- Industry
- Job Position/Title
- Total annual gross salary in EUR (before taxes and deductions)
While promoting the newsletter, I received dramatic feedback about GDPR compliance and running it via Google Forms. Ok, so since it is anonymous, it isn’t in the scope of GDPR. Theoretically, it would be possible to single out a person, but if you look at the data, you will quickly realise it’s impossible because there are at least five or more people with similar characteristics living in Berlin.
Still, I did my best to mitigate the risk of singling out:
- I generalised job titles that were company-specific (e.g. Software Engineer III -> Software Engineer, Graduate → Junior, Principal -> Senior or Intern, Working Student -> Student). The data quality loss was insignificant because you can use compensation and years of experience as additional orientation.
- I renamed most of the “Developers” to “Engineers”; I just needed to decide on something, engineers considering themselves developers, please do not feel offended.
- I rounded the salaries up or down (eg. €33,750 rounded up and €42,370 rounded down).
- Industries with less than five respondents were set to “prefer not to say”.
- I removed self-declared nationalities (<10).
- I removed the timestamp and reordered the entries randomly.
- I amended annual gross salary submissions in cases when the submission was monthly instead of annually (<20).
- I did several other data-cleaning measures, which are too boring to list.