
Abstract
Don’t forget to check the dashboard: it’s here.
Last report update: 15.4.2024
Before you dive in - a dashboard
You can explore the data yourself (and see where you stand) with this great dashboard:
Short intro
This year we are doing it differently. I prepared this basic report instead of a massive data dump and will do deep dives in the coming months. You can participate by sending me questions, DMs or comments on any of my public posts.
This year’s survey was much more focused — it was a salary survey for employees in startups/tech and enterprise space. We wanted to expand to Munich but needed to admit defeat and remove the data. Data quality was better than last year.
Thanks to everyone who participated and supported the data collection phase by publishing links, likes, and reposts. Our guerilla marketing worked; we easily beat last year’s 970 responses. If you want to make sure to participate in 2025, we’ve got you covered. If you liked the project, consider to donate:
Thanks to the team, too: Richard for refactoring, Katya for visuals, Ignacio for dashboarding and Juan for spreading the word. And to Mihaela and Jonathan for the help with the press release.
Who participated this year?
Out of 1302, we had 1150 valid responses (+18.5% Year-over-Year), out of which male were 59.74% (687). 38.61% (444) were female, 1.22% (14) were non-binary, five were “Prefer not to say”.
We decreased the overrepresentation of men by a good 10%.
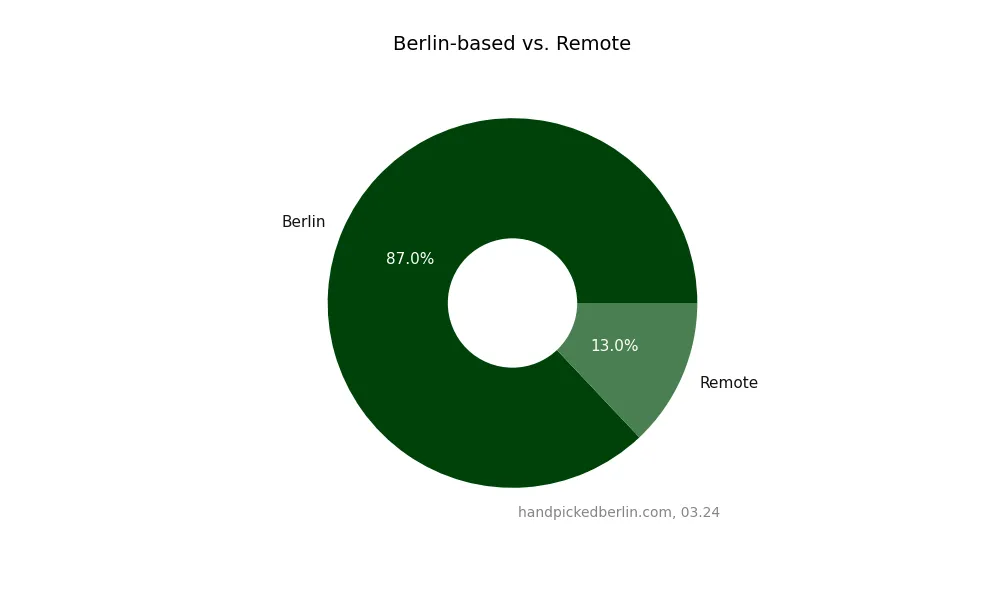
We had 1001 respondent working in Berlin (hybrid/on-site) and 149 respondents working remotely (+3.5% YoY).
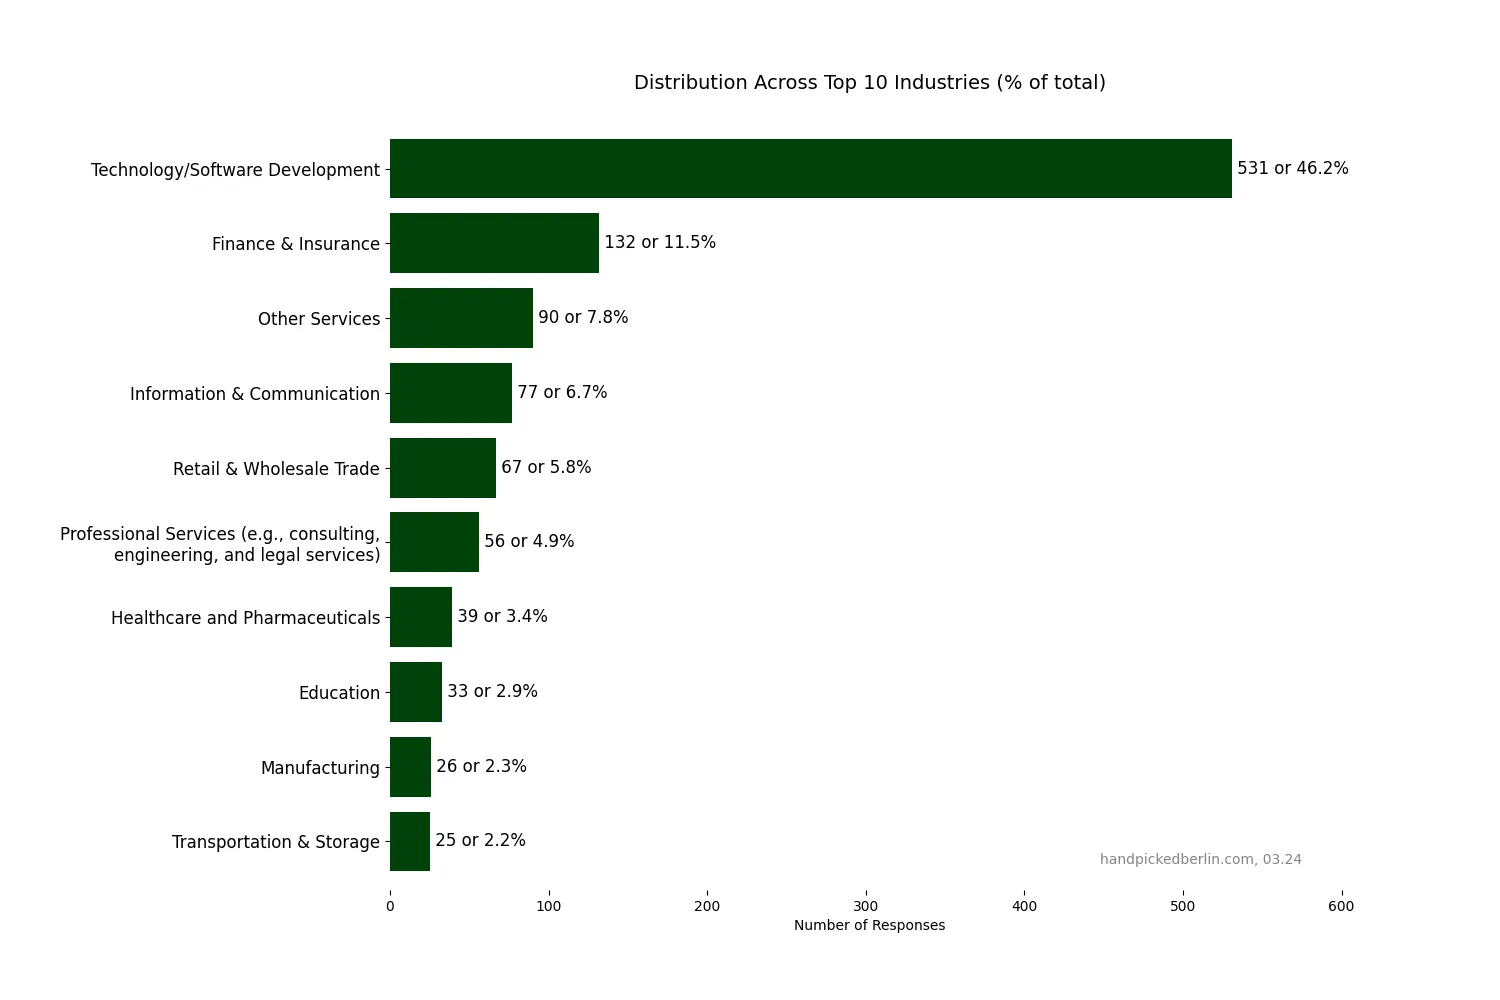
Industries again had a strong bias towards Technology/Software Development (46.2%), followed by Finance & Insurance (11.5%), Other Services (7.8%) and Information and Communication (6.7%). Here are the top 10:
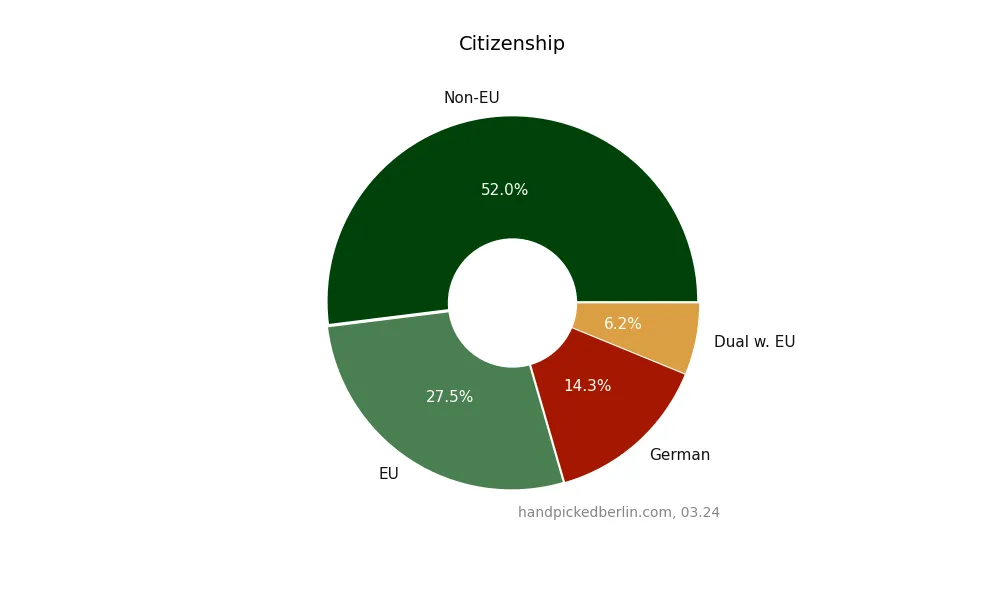
The largest room for improvement is within Citizenship, where German citizens were a minority: around 77% in Berlin, but only up to just above 20% in our survey.
A bit more than half of the respondents had a non-EU passport (app. +4% YoY). Year-over-year, the biggest drop was in the number of German citizens (-11.2%), which is likely related to running fewer paid campaigns in German.
Respondents were highly educated. We had 539 (46.99%) with Master’s Degree, followed by Bachelor’s (436, 38.01%) and Doctor’s (60, 5.23% ). These three largest groups total 90.23% (1035).
In terms of age, the largest group was 30-34 (451, 39.22%), followed by 35-39 (27.13%) and 25-29 (19.91%). This means the age group 25-39 covers 86.26% (992) of the total.
How much were we getting paid?
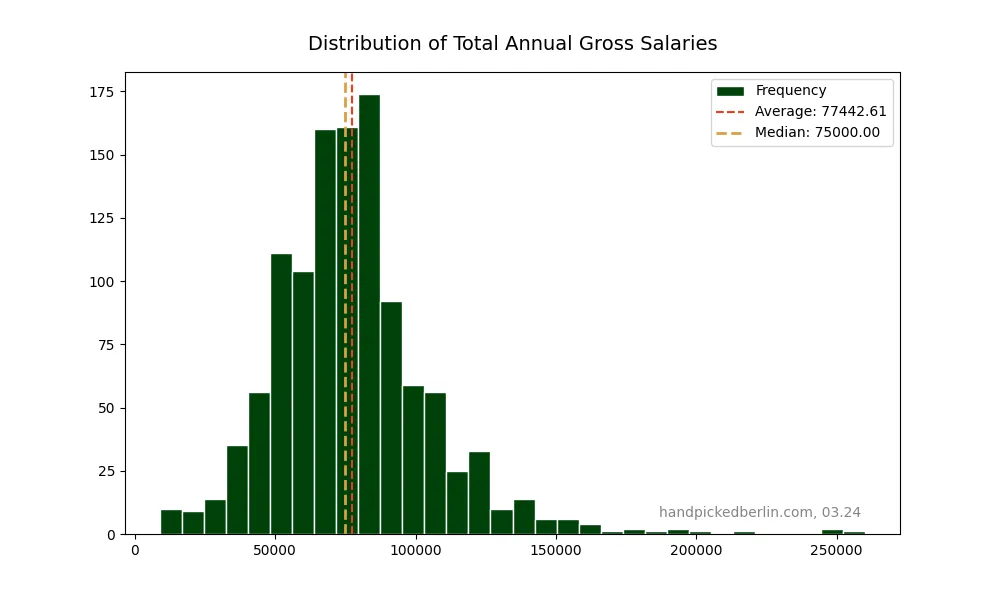
The average total annual gross salary was €77,442.61 (+8.36% YoY). The more precise median was €75,000 (+7.14%). This growth can be explained by a much narrower scope (tech, startup and enterprise) this year.
How big was the gender gap?
It was consistent at around 15% across all respondents, leadership positions and individual contributors.
In median terms, women earned 15% (€68,000) or €12,000 less than men (€80,000). The situation was similar with non-binary (15.94% less, €67,250).
For women in leadership positions, the situation was identical in nominal terms. 99 female leaders earned €83,000 (-14.46%) compared to €95,000 by 195 male leaders.
In the group of individual contributors (825), the gap was €10,000 or 15.38% (€65,000 vs €75,000).
Compared to the latest data for Berlin and Brandenburg, this gap was 4% higher than the average, which is pretty disappointing if we hoped that “the scene” would be more progressive than your average employer.
Which were the best- and worst-paid jobs?
Because of a manual grouping of hundreds of roles, we have many good future deep-dive candidates. First, let’s check the top and bottom five based on the categorisation. The cutoff was at five or more.
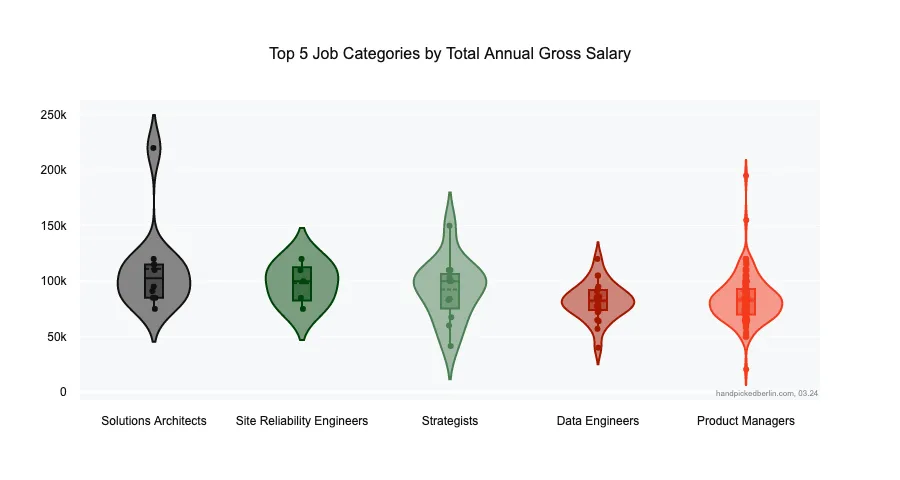
Like last year, winners were Solutions Architects (10 respondents with an average of €111,100 and a median of €102,500). They were followed by Site Reliability Engineers (5 respondents) with a median of €100,000. Third-placed Strategists (14) work more with slides than IDE’s: for a median €100,000. Together on the fourth were Data Engineers (24), with a median of €82,500, which is identical to Product Managers (110).
The largest group, Software Engineers (252), was sixth, together with Program Managers (12), with a median €80,000. These stats definitely need a deeper dive.
The bottom side was “led” by Copy & Content specialists (7) with a median of €50,000. Next were UX/UI Designers (23), with a median salary of €51,500, followed by Project Managers & Coordinators (30), with €56,250. HR - Talent Acquisition professionals (15) earned €60,000. Marketers (57) rounded out the group with €64,500. The range with Marketers shows they are a good candidate for a deeper dive and additional splits.
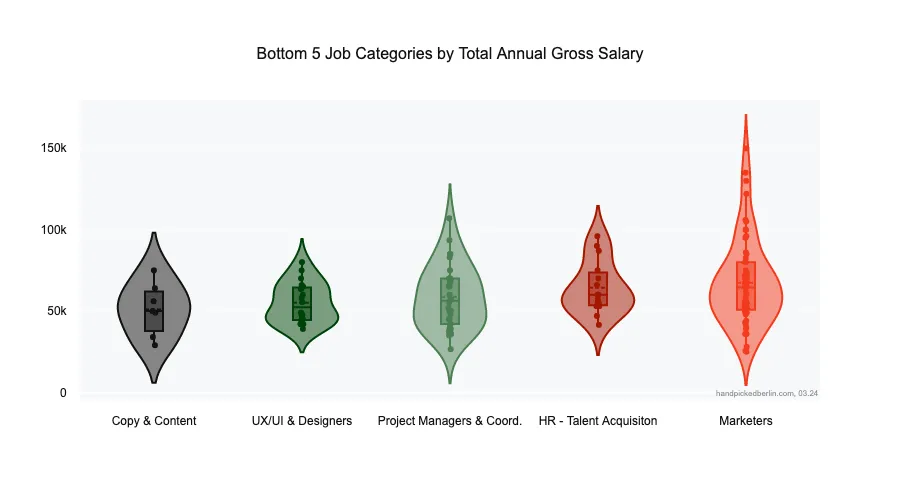
As a former Project Manager and current Product Manager, I am most surprised by the consistent difference between the two roles because both require the same amount of herding cats.
How about best-paid industries?
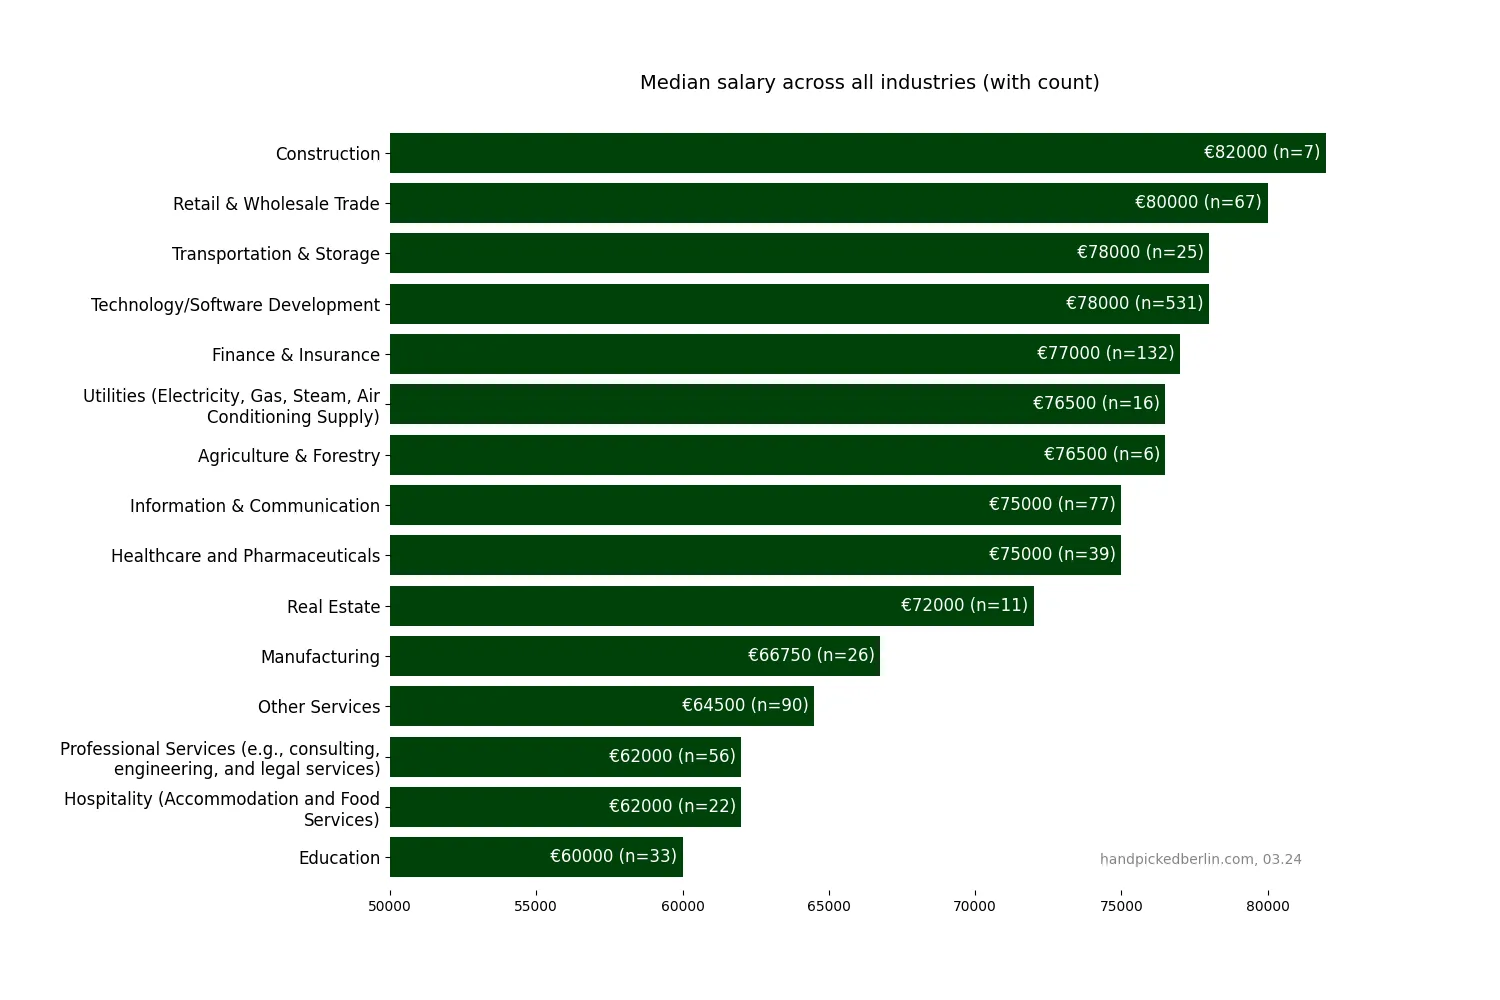
Industries had a strong tech/software development bias, but it’s clear that many of them pay well, especially if we consider that we had over 90% of respondents with higher education. The low median of Professional Services seems particularly interesting. (Notice the Y-axis cutoff)
Did startups really pay less?
This year, we introduced a new question: “Does your company classify as a startup?” This gave us a new quality to the data (419, or 36.47%, did classify as startups, and 693, or 60.31%, didn’t), but surprisingly, there was almost no difference in compensation: the median was identical at €75,000, while the average was €115 higher for startups (€77,718).
You should, therefore, question the “Yes, but we are a startup, so we cannot pay more” argument at your interview.
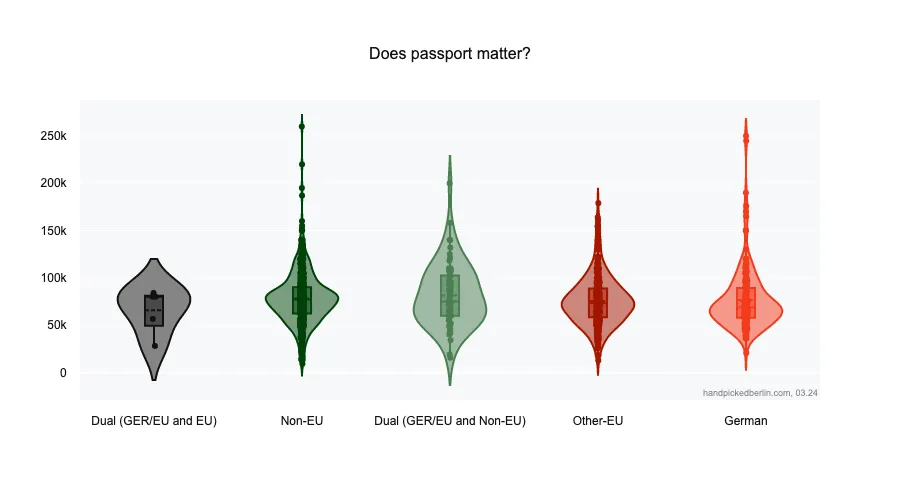
Did it matter if you had an EU passport?
As mentioned, we had a big Non-EU bias, and the passport did make a difference.
Dual (GER/EU and EU) barely passed the threshold of 5 respondents with a median of €80,000, followed by the largest group: 595 respondents with Non-EU passports with a median of €77,000.
Next was Dual (GER/EU and Non-EU), with €75,000 (66), and the second largest group, Other-EU, with 315 respondents, was at €73,000. 164 German passports were last with €68,500, but notice the big range, which was comparable to the Non-EU group.
Put differently, respondents with German passports earned €11,500 less than dual citizens (GER/EU + EU) and €8,500 less than Non-EU passports.
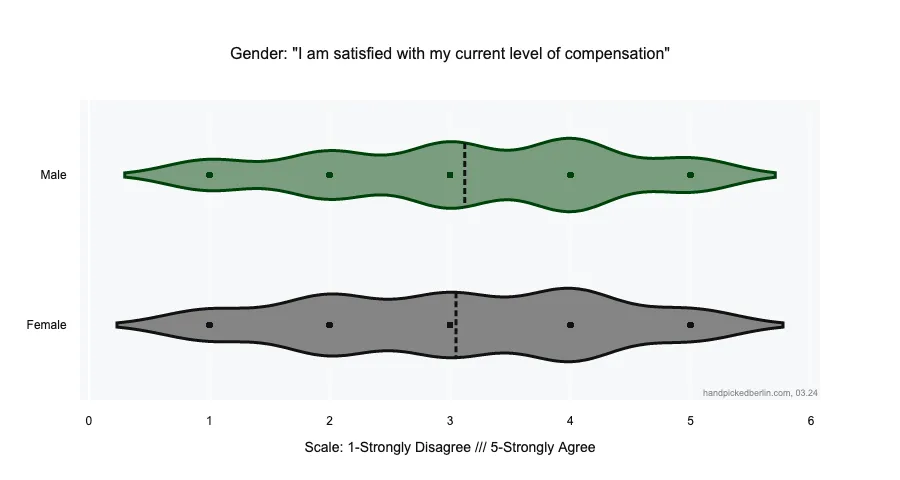
How satisfied were we with the salaries?
The dotted line on the following three violin charts shows the average on the 1-5 Likert scale. In essence, section width relates to the number of answers. Men were more satisfied with their compensation than women (3.12 vs 3.05):
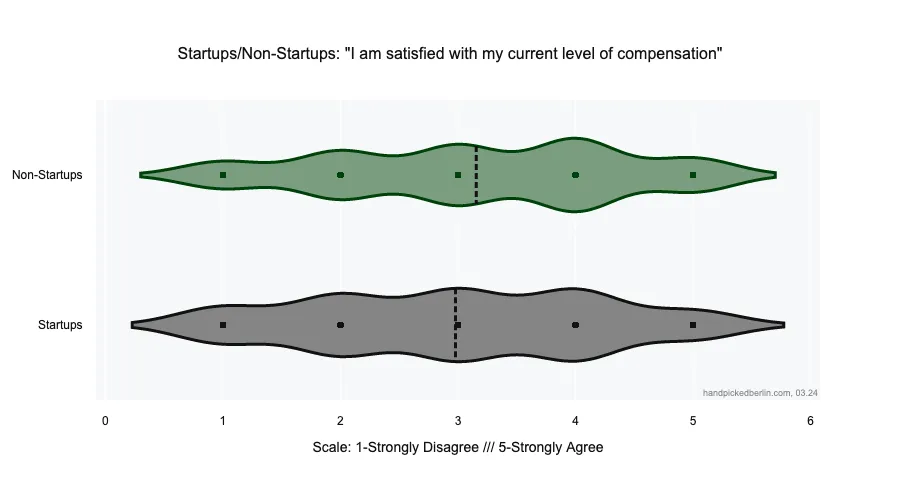
Interestingly, even if salaries between Startups and Non-Startups were comparable, pay satisfaction was markedly lower in startups (2.98 vs 3.15). I can only assume it’s because of longer working hours. For comparison, eight self-employed were at 3.25.
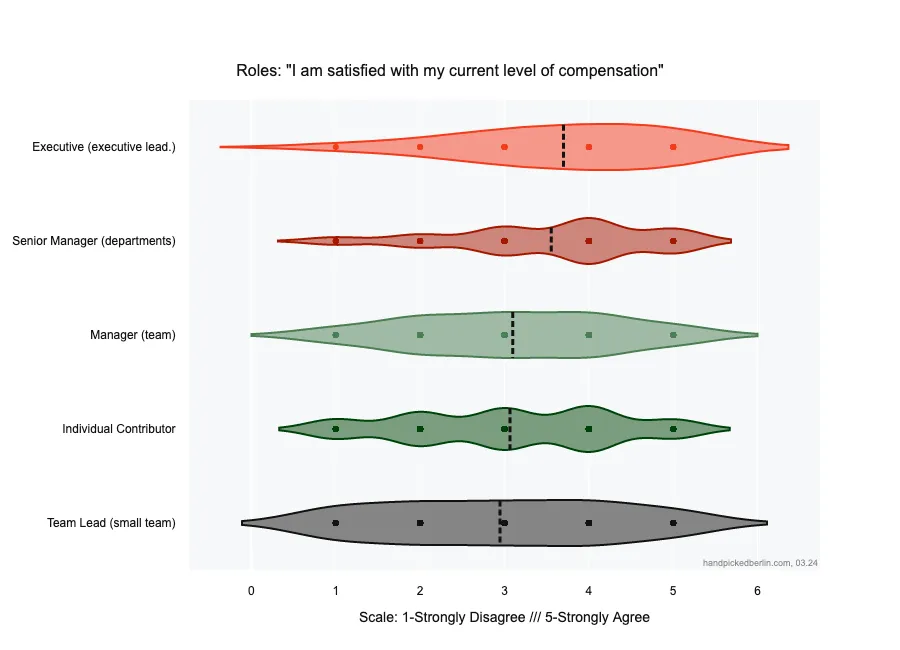
I was interested if the thing that starts with an S and ends with a T really trickles down from the top. And it seems so! Team leads (small team) were most dissatisfied (2.95 with 112 respondents), and that’s pretty understandable: they are a buffer for middle management and their team members (IC@3.07, 824).
The distinction between Team Leads and Managers (3.10, 102) isn’t the clearest, but the more you go to the top, the better it gets. Senior Managers/Directors are at 3.56 (63), and Executives were the most satisfied at 3.70 (20).
How many hours did we work?
A big majority of the respondents worked full-time (1085, 94.43%). The most common contract was 40 hours per week (92.45%, 979), followed by 39 (1.79% or 19). A four-day week (32 hours) was possible for eight respondents (0.76%).
Raises, paid overtime and bonuses?
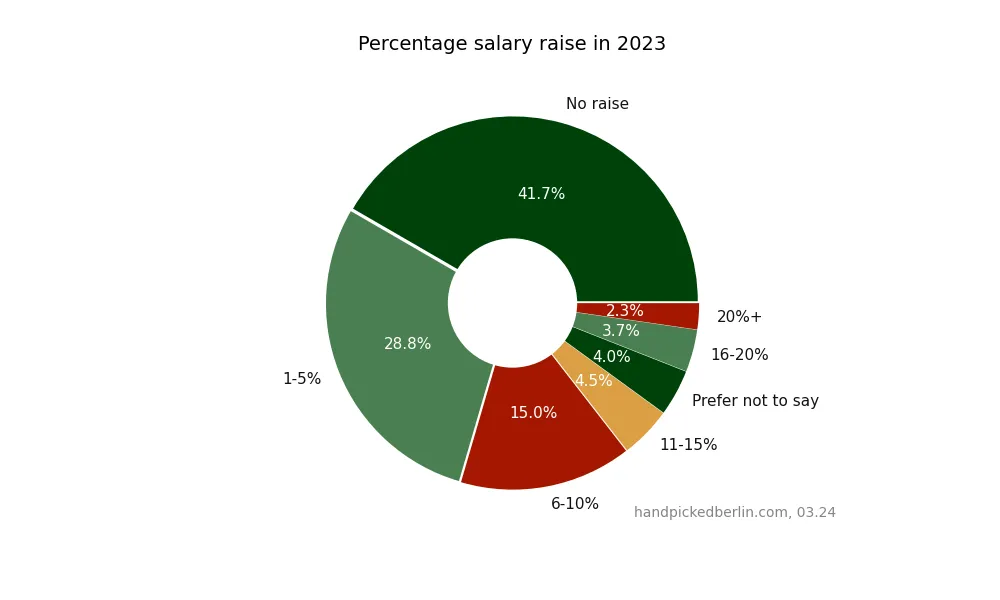
Most respondents got a raise, 41.7% did not (474). These respondents were also obviously not satisfied with their compensation (2.85).
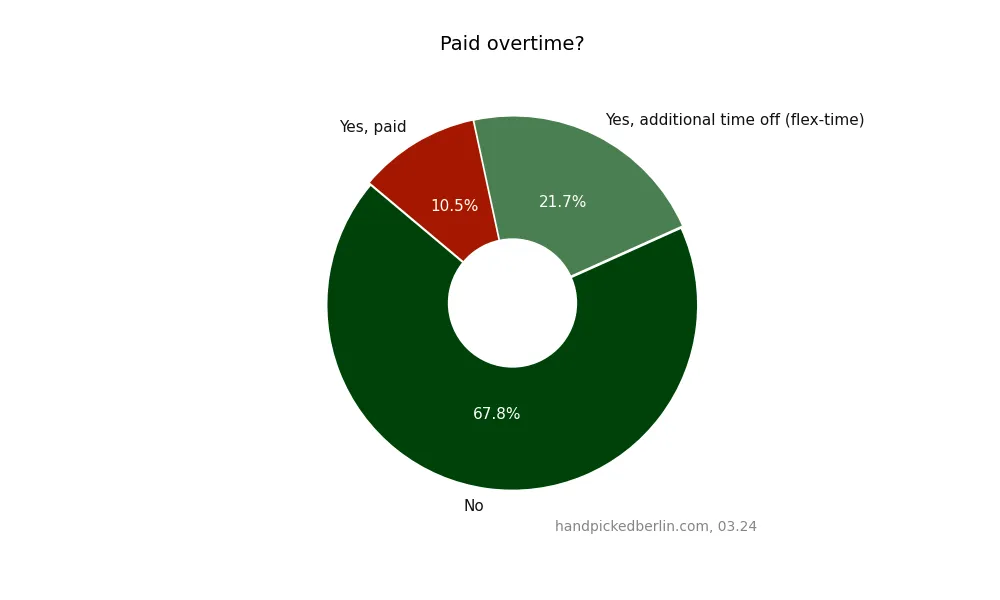
The results on the overtime compensation are clear: most respondents (754) were neither paid nor compensated with flex-time. Flex-time was available to 241 respondents, while 116 got their overtime paid.
Interestingly, on the compensation satisfaction front, the flex-timers were the most unsatisfied (2.94). Paid (overtime) respondents are clear winners (3.25) over not-paid ones (3.10).
Bonus and Equity were foreign to most of the respondents (55.65% or 640). We had 67 respondents with both Bonus and Equity (5.83%). 232 received only a Bonus (20.17%) and 211 only Equity (18.35%).
Average Bonus was 7313.95€ (median: 2000€).
Average Equity was 20199.8€ (median: 4000€).
This was the first shot at the report. Support the project with a donation and a follow:
Ask a question… or what’s still coming?
There are so many things we can have a look into, for example:
- More data from all the mapped job categories (not just the Top & Bottom five)
- Further breakdowns of selected job categories like Marketers, Software Engineers (for example, Frontend vs Backend and similar)
- Does it pay to have a master?
- Does tenure impact pay satisfaction?
- How about years of experience?
- What is “the best” seniority level for individual contributors?
- … (for more inspiration, here are all the questions we had)
I’d love you to let me know what you’d be interested in! Send a question, Direct Message or comment on any social media posts. More is coming, and you can impact it.
Try the dashboard here. ⬅
Frequently asked questions
What is the average salary in Berlin’s tech sector in 2024?
The average total annual gross salary was €77,442.61 (+8.36% YoY). The more precise median was €75,000 (+7.14%)
How has the gender pay gap evolved in Berlin?
The gender pay gap was consistent at around 15% across all respondents, leadership positions and individual contributors. In median terms, women earned 15% (€68,000) or €12,000 less than men (€80,000). The situation was similar with non-binary (15.94% less, €67,250).
What are the highest-paying jobs in Berlin’s tech industry?
The best paid in Berlin were Solutions Architects (10 respondents with an average of €111,100 and a median of €102,500). They were followed by Site Reliability Engineers (5 respondents) with a median of €100,000. Third-placed Strategists (14) work more with slides than IDE’s: for a median €100,000.
Do startups in Berlin pay less than larger companies?
No. There is almost no difference in compensation: the median was identical at €75,000, while the average was €115 higher for startups (€77,718).
Does nationality impact salary in Berlin?
Respondents with German passports earned €11,500 less than dual citizens (GER/EU + EU) and €8,500 less than non-EU passports. (Data has a big Non-EU bias)
Are employees satisfied with their salaries in Berlin’s tech scene?
Men were more satisfied with their compensation than women (3.12 vs 3.05). Pay satisfaction was also lower in startups (2.98 vs 3.15).
How many employees work remotely in Berlin?
Only 13% or 149 respondents worked remotely.
How are raises and overtime handled in Berlin’s tech companies?
Most respondents (754) were neither paid nor compensated with flex-time for overtime. Flex-time was available to 241 respondents, while 116 got their overtime paid.
What is a good salary in Berlin?
It depends on the industry and your experience, but anything above €50,000 would be considered a good salary for Berlin.
What are the best-paid jobs in Berlin?
That’s easy: jobs in the tech or software development industry or closely related fields (e.g. tech-related roles in other industries). For example, Solution Architects, Software Engineers, Consultants, Product Managers, Data Engineers, Program Managers.
How much do UX/UI designers earn in Berlin?
The median salary in 2024 was €51,500 (23 respondents).
How much do marketers earn in Berlin?
The median salary in 2024 was €64,500 (57 respondents).
How much do data engineers earn in Berlin?
The median salary of data engineers was €82,500 (24 respondents).
How much do Program Managers earn in Berlin?
The median salary of Program Managers was €80,000 (12 respondents).
How much do Project Managers earn in Berlin?
The median salary of Project Managers & Coordinators was €56,250 (30 respondents).
Which are the best-paid industries in Berlin?
The best-paid industries are Construction, with a median of €82,000 (7 respondents), Retail and wholesale Trade €80,000.0 (67), Technology/Software Development €78,000 (531), Transportation and storage €78,000 (25), and Finance and insurance €77,000 (132).
Appendix
Noticed mistakes? Do let me know.
How do you use this data?
Note that the data is self-reported and biased. Use it as an orientation only. When comparing yourself, take industry, age bracket, years in the role and the actual role (team leads, managers, etc.) into account.
Why (mostly) median salary and not average?
Comparing median salaries offers a more accurate representation of what a typical individual earns because the median is less affected by outliers. Few top earners can disproportionately skew earnings, so the average salary can appear misleadingly high. The median is the middle value and more realistically reflects the typical income.
Notes on data cleaning
We processed the data extensively to get it to the final form. For example:
- Data Cleaning and Standardization: We removed timestamps from Google, randomized the order, corrected common typos and removed several variations of job seniorities, we rounded the salaries, bonus and equity up or down to closest 500. We did our best so that job titles were consistent throughout the dataset.
- Filtering and Privacy: We removed respondents who are not working in Berlin or for a Berlin-based organisation. We anonymized industries that appear too infrequently (less than or equal to five times) by labelling them as “Prefer not to say”.
- Job Classification: We categorized job titles based on keywords associated with different job categories. Job titles that don’t match any predefined category are classified as “Other.”
Mandatory questions were:
- Are you currently employed in Berlin or by a Berlin-based organization?
- Gender
- Age
- Type of organisation
- Industry
- Job Position/Title
- Total annual gross salary in EUR (before taxes and deductions)
All the questions with values. The survey was open in March 2024.