
Summary of key findings
- Salary growth stagnated with the median salary unchanged at €75,000 and the average gross annual salary increasing only 1.46% to €78,574.25, significantly lower than in 2024.
- Gender pay gap widened to over 20% with women earning a median of €66,000 compared to €83,000 for men. Even when controlling for experience and role, the gap remains substantial at 14.9%.
- Software Engineering still pays the most with technical leadership roles commanding top salaries (€110,000), followed by specialised roles in infrastructure (€101,000) and security (€94,000).
- Job mobility is high with nearly one-third (30.82%) of respondents likely or very likely to change jobs in 2025, with lower-paid employees more likely to switch.
- German language skills are surprisingly irrelevant for compensation, with non-German speakers often earning more than fluent speakers, suggesting Berlin’s tech ecosystem struggles to attract German-speaking talent.
(last update: 25.4.2025)
About this report
Welcome to Berlin’s most comprehensive tech salary report to date. With 1,845 valid submissions—a 60% increase from last year’s 1,150—this 2025 edition offers great insights into Berlin’s tech compensation landscape.
Besides the total number of responses, the most significant improvement is related to job categorisation. We’ve broken down major groups like Software Engineers into more granular categories (Backend, Frontend, SRE, etc.), providing more targeted benchmarks this year and in the future. This granular approach enabled us to successfully categorise over 94% of all submissions.
Our data cleaning process was more efficient this year thanks to last year’s improvements (thanks again, Richard!). We excluded 140 entries that were either outside Berlin or contained clearly implausible information.
Unlike previous editions, this year’s report prioritises comprehensive analysis over dashboard visualisation (which might follow later). This means a much more detailed read, but we tried to ease the navigation with a detailed table of contents and “back to top” arrow in each chapter. It looks like this: ⤴
If you have a question or a suggestion, contact me here.
Thanks to everyone who participated with data and by sharing the link on internal and social channels, and to all the great communities that supported the project. Your participation makes this possible.
To make sure you receive all upcoming deeper dives and updates, subscribe to the Handpicked Berlin newsletter and set a reminder for 2026:
Report limitations
This report represents the most comprehensive Berlin salary dataset to date (1845 respondents, up 60% from last year), but please consider the following:
- Self-selection bias: As with any voluntary survey, participants self-select to respond, potentially attracting those more comfortable sharing compensation details. This may influence overall averages compared to the broader workforce.
- Demographic skew: The data reflects Berlin’s international tech ecosystem, with German passport holders accounting for 15.66% of respondents (versus approximately 75% of Berlin’s general population). This provides excellent insights for international professionals but may not fully represent local German compensation patterns.
- Sample size variations: While the overall sample is robust, some specialised roles or demographic subgroups have smaller sample sizes. Categories with fewer than 20-30 respondents should be viewed as directional.
This survey provides valuable insights into Berlin’s tech ecosystem, particularly for:
- Technology/Software Development (42.6% of respondents)
- Mid-career professionals (80% have 3-15 years of experience)
- International talent (84% non-German)
For optimal use:
- Consider sample sizes when examining subgroups, and look at median values to minimise outlier effects
- Compare within similar experience brackets, industries and roles
- View the data as directional guidance rather than absolute benchmarks
The dataset’s strengths include detailed categorisation of roles (53 categories), comprehensive demographic information, and significant improvements in gender representation. This makes it a great orientation tool for understanding compensation trends in Berlin’s international tech community. ⤴
Who works in Berlin’s tech industry?
What is the gender distribution?
Out of 1845 total respondents this year, we had 996 male respondents (53.98%), 820 female respondents (44.44%), 15 non-binary respondents (0.81%), and 14 who preferred not to say (0.76%).
This represents a continued improvement in gender representation compared to last year. The overrepresentation of men has decreased further, with male participation dropping from 59.74% to 53.98% (-5.76%). Female participation increased significantly from 38.61% to 44.44% (+5.83%), showing strong progress toward gender balance in our survey.
The total number of valid responses grew from 1150 to 1845, representing a substantial 60.43% increase year-over-year. ⤴
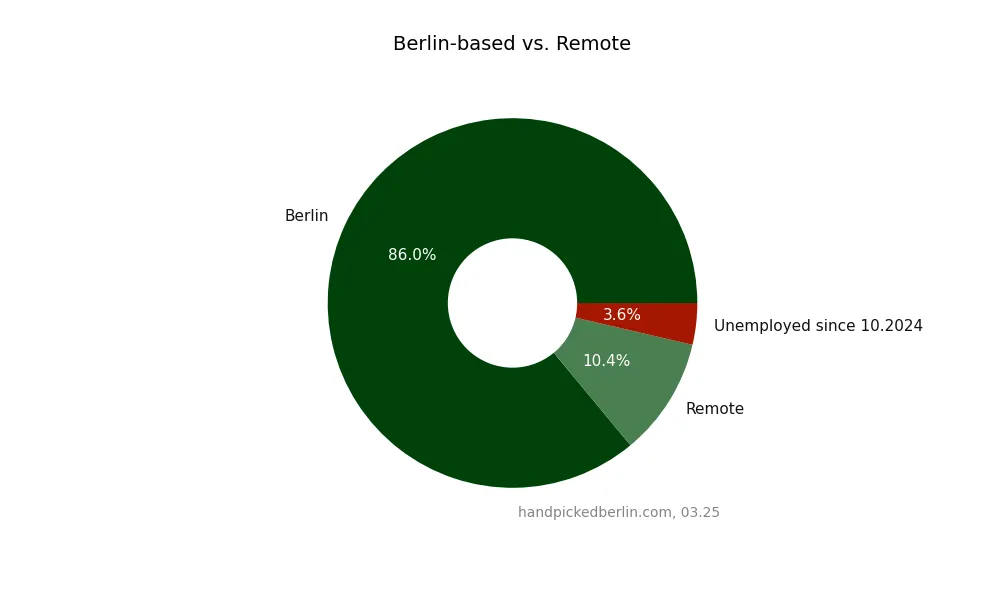
Where do tech professionals work?
This year, 1587 respondents (86.02%) worked in Berlin (hybrid/on-site), while 191 respondents (10.35%) worked remotely. A new data point this year was respondents who got unemployed in the last quarter of 2024: 67 (3.63%).
Remote respondents dropped from 13% to 10.35%. ⤴
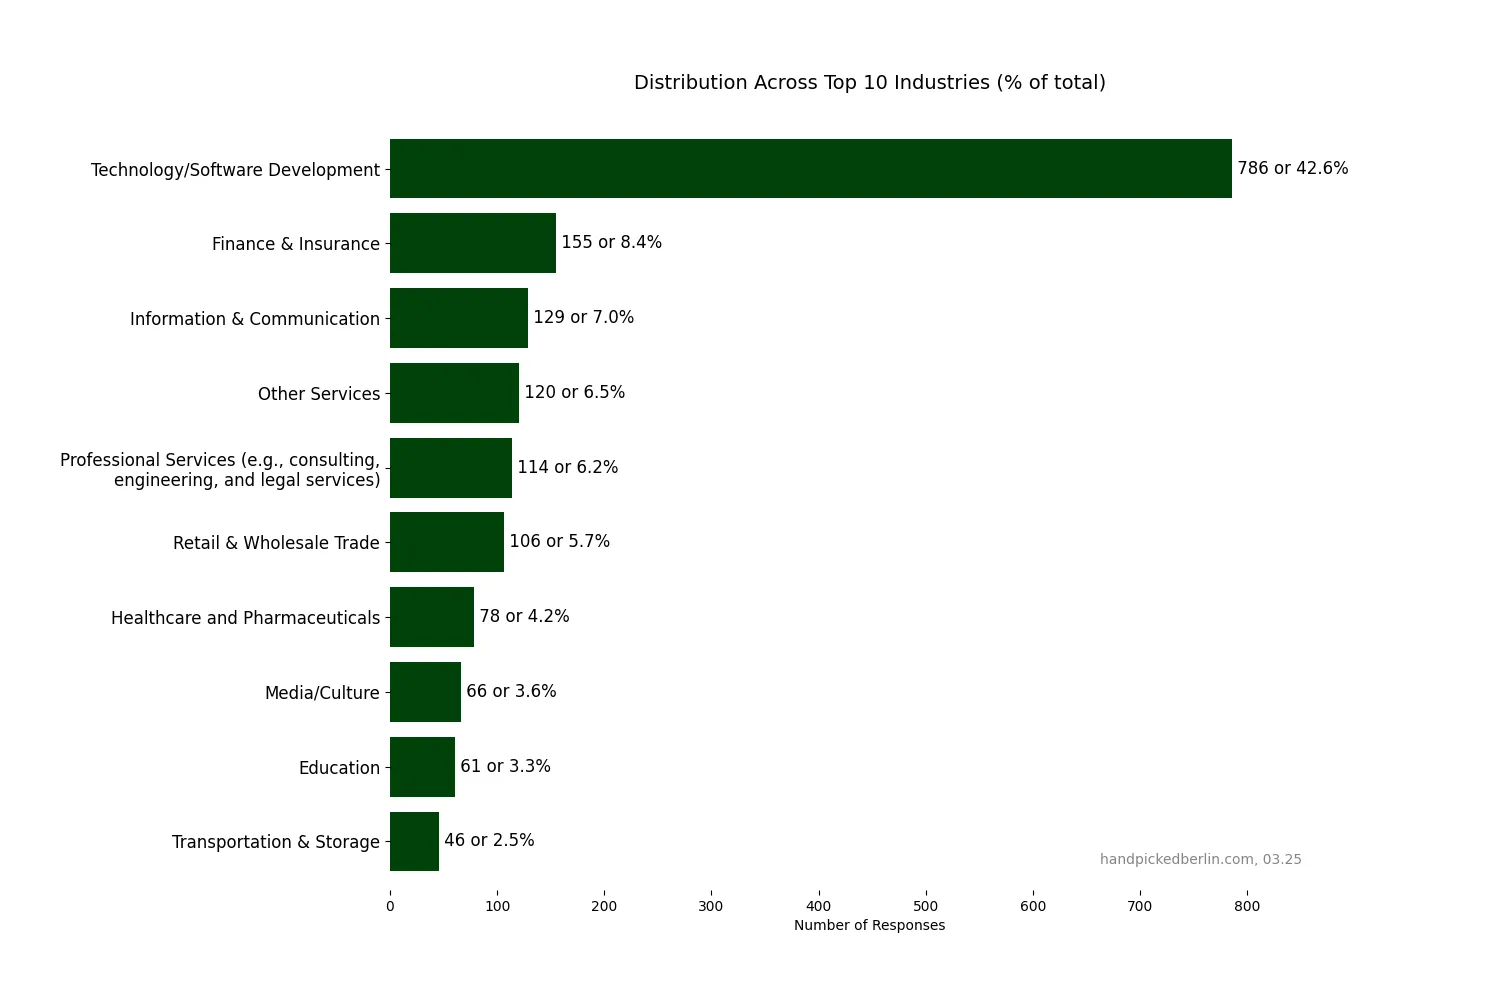
Which industries employ the most people?
Similar to last year, Technology/Software Development dominates at 42.6% (down from 46.2%), followed by Finance & Insurance at 8.4% (down from 11.5%). Information & Communication rose to third place at 6.99% (up from 6.7%). This year, we also added Media/Culture (3.58%). Here are the top 10:
How do people work: full-time vs part-time vs freelance?
The vast majority of respondents (1700 people, 92.34%) work full-time. 118 people (6.41%) work part-time, and only 23 respondents (1.25%) work as contractors or freelancers. ⤴
How many work as individual contributors vs team leads?
The majority of respondents (1272, 69.21%) work as individual contributors with no direct reports. The remaining workforce is distributed across various leadership levels: 188 (10.23%) work as team leads managing small teams, 166 (9.03%) are managers, 128 (6.96%) serve as senior managers/directors, and 30 (1.63%) hold executive positions.
Working students/interns account for just 24 respondents (1.31%). ⤴
Which passports do the workers hold?
Nearly half of our respondents (859 people, 46.56%) hold a Non-EU passport, continuing the trend from last year. EU passport holders (excluding Germans) make up 496 respondents (26.88%), while German citizens represent just 289 people (15.66%) of the total.
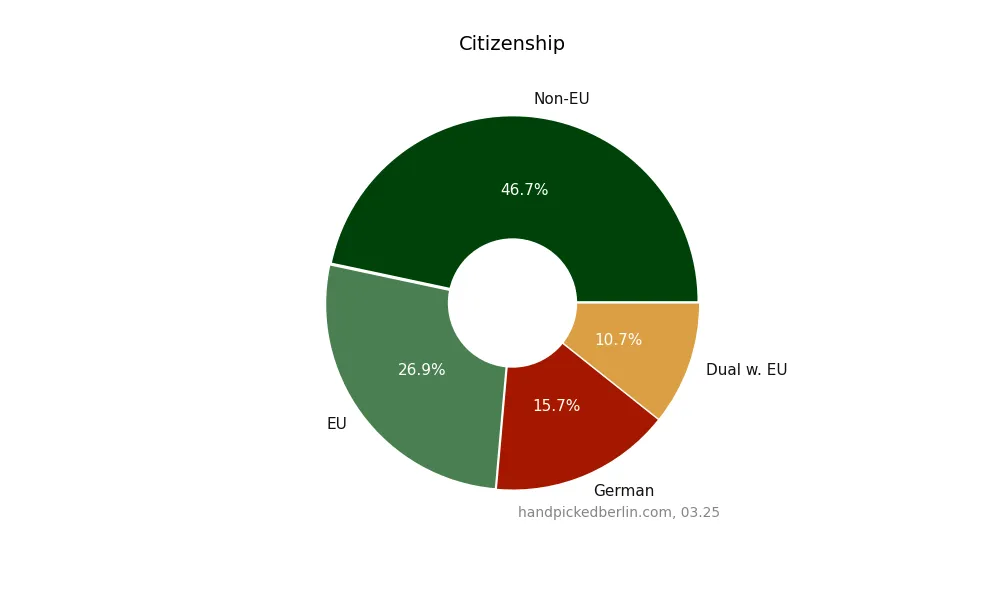
The representation of German passport holders continues to be disproportionately low compared to Berlin’s general population (where Germans make up approximately 75%). This year’s percentage of German citizens (15.66%) increased a bit (vs 14.3% last year), and some might also be a part of the Dual EU passport group (197, 10.68%). ⤴
Note: Dual with EU group includes both, Dual (GER/EU and Non-EU) with 165 (8.94%), and Dual (GER/EU and EU) with 32 (1.73%).
What are the education levels?
The Berlin tech scene continues to be dominated by highly educated professionals. 905 respondents (49.27%) hold a Master’s Degree, showing an increase from last year’s 46.99%. Bachelor’s Degree holders account for 677 people (36.85%), slightly down from 38.01% last year.
The third largest group has shifted from Doctor’s Degrees to Diplomas (4-year studies), with 74 respondents (4.03%) holding Diplomas. Doctor’s Degree holders now rank fourth with 70 respondents (3.81%), down from 5.23% last year.
Together, the four largest educational groups (Master’s, Bachelor’s, Diploma, and Doctor’s) represent 93.96% of all respondents (1726 people), similar to last year, showing a highly educated profile of participants of the survey. ⤴
What is the age distribution?
The largest age group remains 30-34 years with 654 respondents (35.45%), followed by 35-39 years with 528 respondents (28.62%), and 25-29 years with 344 respondents (18.64%).
Together, these three age groups (25-39 years) account for 82.71% of all respondents (1526 people), showing a slight decrease from last year’s 86.26%. This indicates a subtle shift toward greater age diversity, with increased representation from the 40-44 age group at 10.68% (197 respondents). ⤴
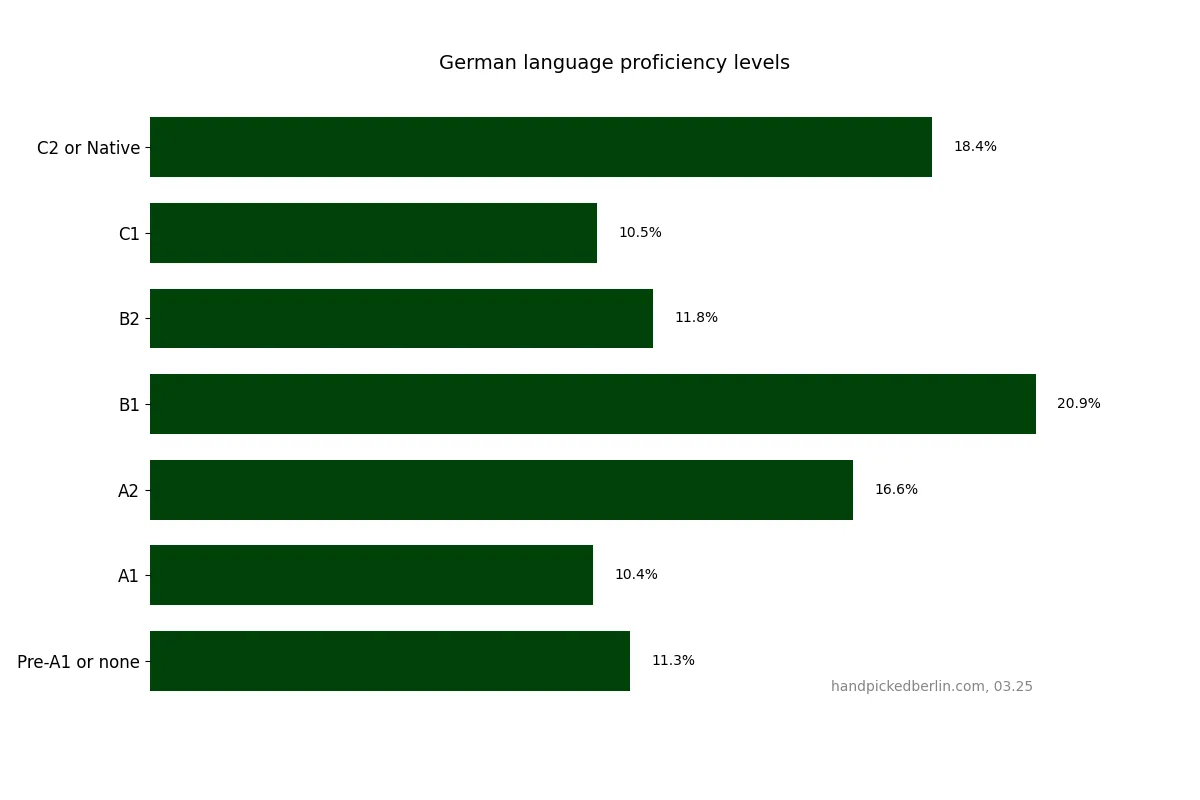
How fluent are workers in German?
This year we introduced a new question to assess German language proficiency among tech professionals in Berlin.
The most common proficiency level is B1 (intermediate) with 384 respondents (20.82%), followed closely by C2 or Native speakers at 339 respondents (18.38%). The third largest group is A2 (basic) with 305 respondents (16.54%).
The remaining respondents are distributed across other levels: B2 (11.82%), Pre-A1 or none (11.28%), C1 (10.52%), and A1 (10.41%).
It’s clear that the majority function with intermediate or basic German proficiency. ⤴
How experienced is the workforce?
Most tech professionals in Berlin have substantial experience, with the majority (36.62%) having 6-10 years in their fields. Mid-career professionals with 11-15 years make up 26.32%, while 17.55% have 3-5 years of experience. These three groups represent 80.49% of all respondents, with entry-level professionals (less than 3 years) accounting for just 4.09%. ⤴
How long do people stay at the companies?
Not very long! The largest group (33.55%, 615 respondents) has been with their employer for 3-5 years, followed closely by those with 1-2 years tenure (31.21%, 572 respondents). Nearly a quarter (24.17%, 443 respondents) have been at their company for less than a year.
These three categories combined account for 88.93% (1630) of all respondents! Only about 10% of participants have remained at their companies for 6 or more years, with very few (2.24%) staying beyond the 10-year mark. ⤴
What company sizes dominate the scene?
Large corporations with 1000+ employees, representing 35.44% (650 respondents). Mid-sized companies with 51-200 employees account for 19.96% (366 respondents), while those with 201-500 employees make up 14.23% (261 respondents).
Smaller companies with 1-10 employees have minimal representation at just 5.29% (97 respondents). ⤴
What are the company types?
Logically, private firms are by far the most common, employing 87.05% (1606 respondents). Far behind are social/impact businesses (a new category this year) at 3.52% (65 respondents) and NGOs at 2.71% (50 respondents).
These three largest categories combined account for 93.28% (1721) of all respondents. All other company types, including self-employment, state-owned enterprises, and public sector entities, collectively represent less than 7% of the total. ⤴
How many work at startups vs established companies?
Only 29.26% (539 respondents) work at startups this year, compared to 36.47% (419 respondents) last year—a decrease of 7.21%. Meanwhile, the vast majority (66.4%, 1223 respondents) are employed at established companies, up from 60.31% (693 respondents). ⤴
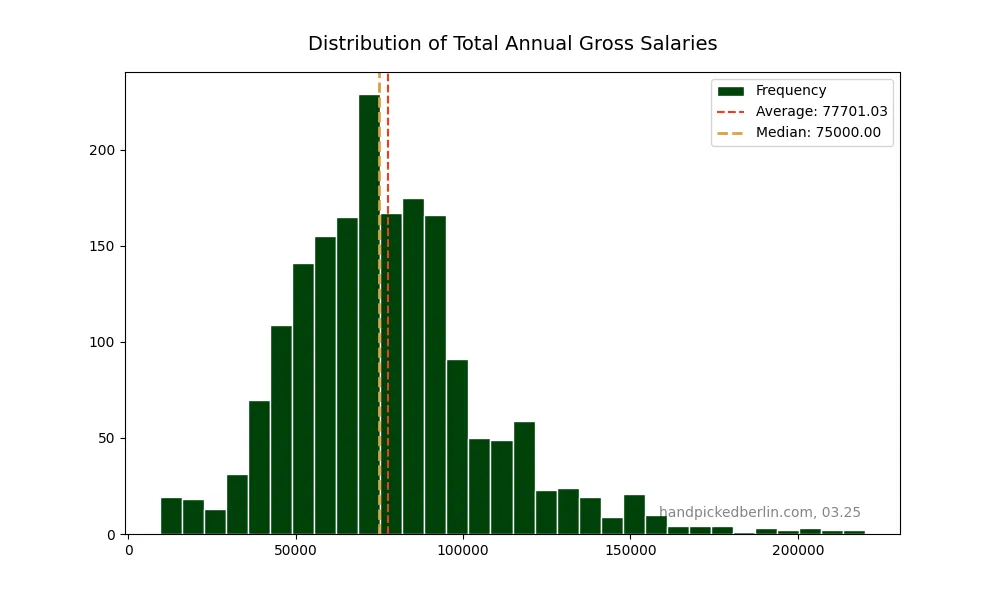
What are the average and median salaries?
Salary growth was modest. The average gross annual salary increased by just 1.46% to €78,574.25 (from €77,442.61), while the median remained unchanged at €75,000. This represents a notable slowdown in median compared to last year’s 7.14% growth.
But! One growth-related factor for the growth in 2024 was a much narrower tech/enterprise scope compared with 2023.
When excluding interns and working students, this year’s average salary stands at €79,343.77, a slight 1.38% increase from last year’s €78,261.90, with the median again holding steady at €75,000. ⤴
(Note on the histogram: outliers above €230,000.00 are removed, so the average is lower)
How much does experience increase salaries?
Experience matters. We’ve seen clear salary progression across experience levels, especially during the first 10 years of a tech career. A deeper dive into these patterns is included in our internal analysis set. ⤴
Do larger companies pay better?
Data says so. We can see a clear progression as organisations grow larger, though with diminishing returns at the upper end. The most substantial salary jumps occur when moving from micro-companies to small businesses, with a 25% increase between the 1-10 and 11-50 employee brackets.
Company size has a measurable impact on salary levels — especially when moving from very small to mid-sized teams. More detailed breakdowns are part of our employer-facing materials. ⤴
How large is the gender pay gap?
The gender pay gap has increased compared to last year, now standing at over 20% across all respondents (vs 15% last year). It probably also has to do with more women participating this year.
In median terms, women earned 20.48% (€66,000) or €17,000 less than men (€83,000). The situation was worse for non-binary respondents (25.30% less, €62,000).
For women in leadership positions, the gap has widened significantly. Female leaders make up 40.28% of leadership respondents, they earned a median of €75,500 compared to €100,000 for male leaders - a difference of €24,500 or 24.5% (vs 14.46% last year).
In the group of individual contributors, the gap was €13,250 or 16.99% (€64,750 for women vs €78,000 for men).
This growing disparity suggests that despite increased awareness of gender inequality in compensation, the tech and startup sectors in Berlin are experiencing a concerning trend in the wrong direction. It’s fair to say that equal quality work should mean equal pay.
So let’s dig a bit deeper and control for experience level and role with full-time employees only. ⤴
Does a gender pay gap exist when controlling for experience level and role/seniority level?
Even after accounting for experience and job level, a significant gender pay gap remains. We believe this insight should drive further conversation and welcome collaboration to continue improving our dataset. ⤴
Does German fluency lead to higher pay?
We can finally answer the question of whether learning German will help you get paid more. Well, unfortunately, it won’t. You can see that the C1 level pays the worst!
This suggests that international specialists are valued more highly than local talent (which is probably not even available - a lot of Germans and German-speaking tech people work in southern Germany), with companies willing (or needing?) to pay premium salaries to attract non-German speakers with specialised technical skills (probably in the area of Software Engineering). ⤴
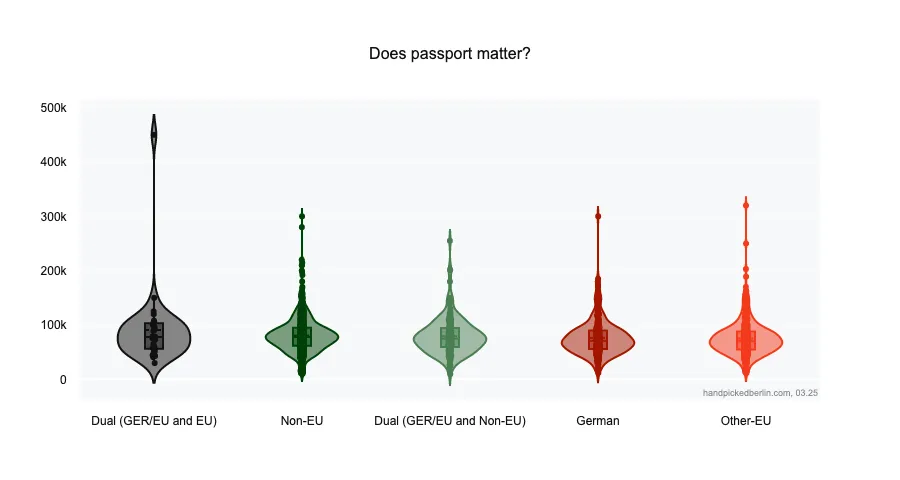
Does citizenship affect the compensation?
Yes, citizenship does make a difference. We again see a big Non-EU bias in our respondents, with this group also enjoying better compensation.
Non-EU citizens made up our largest group (859 respondents, 46.56%) with a median salary of €78,000. Next were respondents with dual citizenship, including EU (197) at €76,000.
German citizens came in third place with a median of €71,000 among 289 respondents, while other EU citizens were last at €70,000 (496 respondents).
Put differently, German citizens earned €7,000 less than their non-EU counterparts, and other EU citizens earned €8,000 less. This continues a pattern we’ve seen in previous years, where international talent from outside the EU gets a premium compensation in Berlin’s ecosystem. ⤴
Note: Dual with EU group includes both, Dual (GER/EU and Non-EU) with 165 (8.94%), and Dual (GER/EU and EU) with 32 (1.73%).
The same data (but with “Dual with EU or non-EU” split) in a chart, where you can also clearly see the outliers:
How does compensation differ across citizenship categories with equivalent years of experience?
Patterns around citizenship and pay reveal persistent disparities across groups. This is an area where we’re continuing to dig deeper and welcome thoughtful input. ⤴
How does education level affect salary?
In general, it doesn’t. The data suggests that practical skills and experience may matter more than formal academic credentials. Respondents are highly educated (1726, median €75,000), but respondents without higher education earn more (119, €77,000 or €2,000 more). This is likely also because of the small sample size.
It’s interesting to see that a PhD in median terms isn’t worth much more than a Master’s or Bachelor’s, but the average is a clear sign that some employees with a PhD earn well above the median.
Which roles pay the most and least?
This year high response numbers enabled an improved role categorisation. We ended up with 53 different categories with almost 1100 different job titles. Compared with last year, “Software Engineers”, “Operators”, “Analysts” and others are now split, which gives a better granular view, but of course, has a setback that some categories have a very small sample size. Here is the complete overview, sorted by average salaries, before we jump into the top and bottom 10. ⤴
The year-over-year comparison is impossible because “Job Title” is one of the rare free-text fields in the survey. This means that inputs are sometimes impossible to properly categorise.
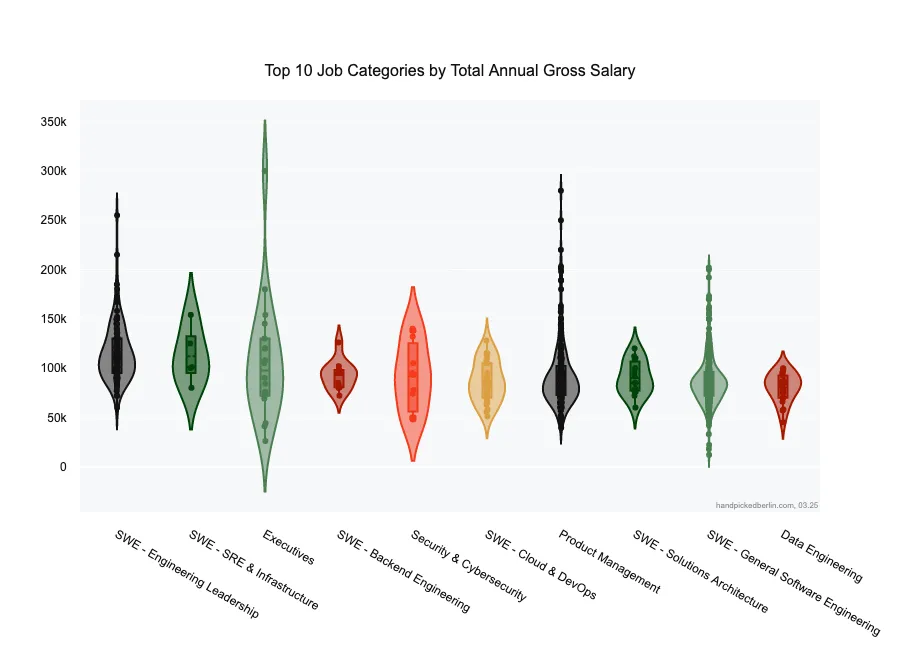
This year’s salary crown (5 or more respondents, median!) goes to managers: SWE - Engineering Leadership roles (97 respondents) with a median of €110,000, followed by SWE - SRE & Infrastructure specialists (5) at €101,000. Executives (18) take third place with a median of €97,500.
Backend Engineering (10) claims fourth with a median of €95,000, while Security & Cybersecurity (15) rounds out the top five at €94,000.
The largest respondent group in general and in our top 10, General Software Engineering (287), is in ninth place with a median of €84,000.
The trend is clear: specialised software engineering roles dominate the highest-paid positions, with 7 of the top 10 spots belonging to various engineering disciplines. ⤴
You can see how wide the spreads are in these violin charts:
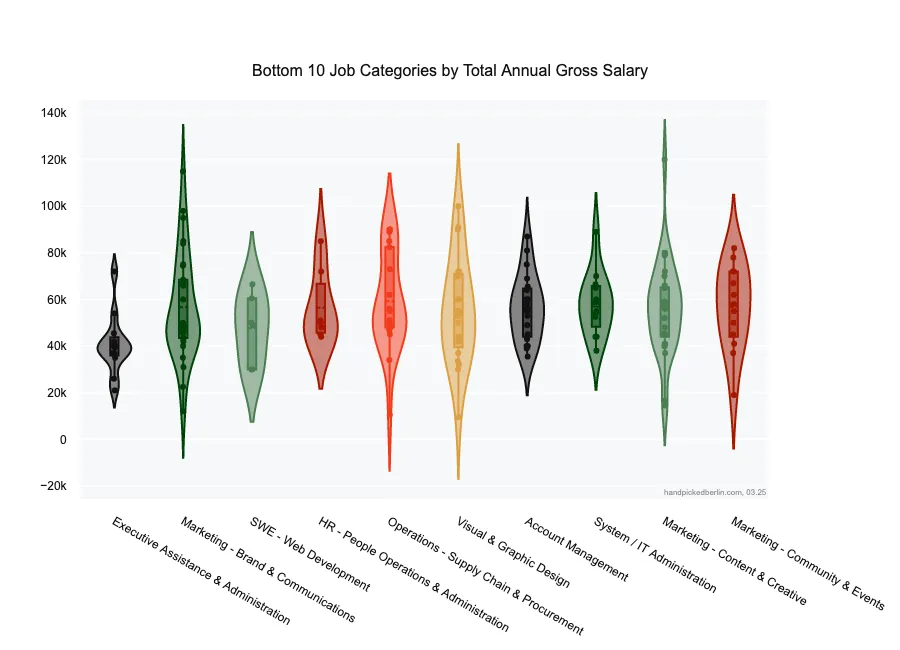
At the bottom of this year’s salary rankings (5 or more respondents, median!), we find Executive Assistance & Administration roles (12 respondents) with a median of €39,750. Marketing - Brand & Communications (30) follows at €48,250, while SWE - Web Development (6) comes in third lowest at €49,500—the only engineering category appearing in our bottom 10.
HR - People Operations & Administration (7) lands at €50,000, with Operations - Supply Chain & Procurement (22) just above at €51,000. Visual & Graphic Design (20) follows with €53,500, then Account Management (20) at €55,500—though this could be understated as we’re only considering base salary.
Rounding out the bottom 10 are System/IT Administration (12) at €57,000, Marketing - Content & Creative (29) at €57,500, and Marketing - Community & Events (13) at €58,000.
Again, check the spreads. Each dot represents a salary data point, which means you can earn very well in any of the categories. ⤴
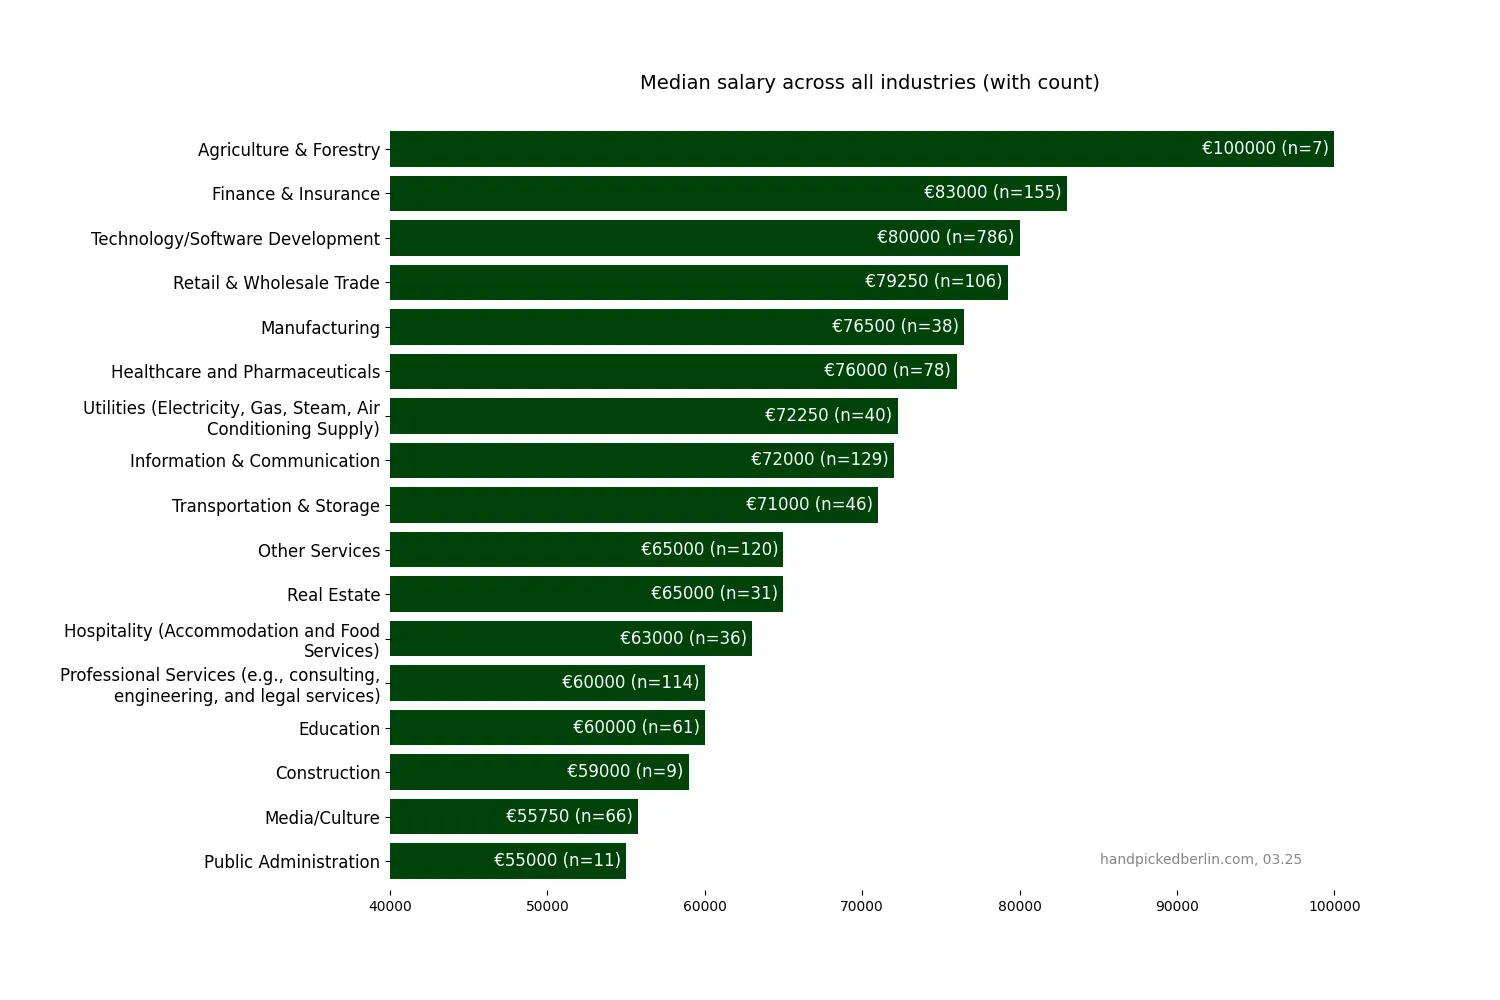
Which industries offer the highest salaries?
As expected, we again have a strong tech/software development bias, but it’s clear that good salaries can be found in almost all industries, especially for highly educated workers. This year, we added Media/Culture (€55,000, 66). ⤴
(Notice the Y-axis cutoff and low number of respondents in the leading industry!)
Do startups pay more or less than established companies?
This year, we had 539 respondents (29.26%) working at startups and 1,223 (66.4%) at established companies.
We have identical median salaries of €75,000 for both, startups and established companies. This consistent finding challenges the (old?) common narrative that startups pay less than established companies.
Looking at averages tells a slightly different story: startup employees reported a higher average salary (€80,424.86) compared with established companies (€78,041.29)—a small 3% advantage for startups. ⤴
How high is the salary satisfaction?
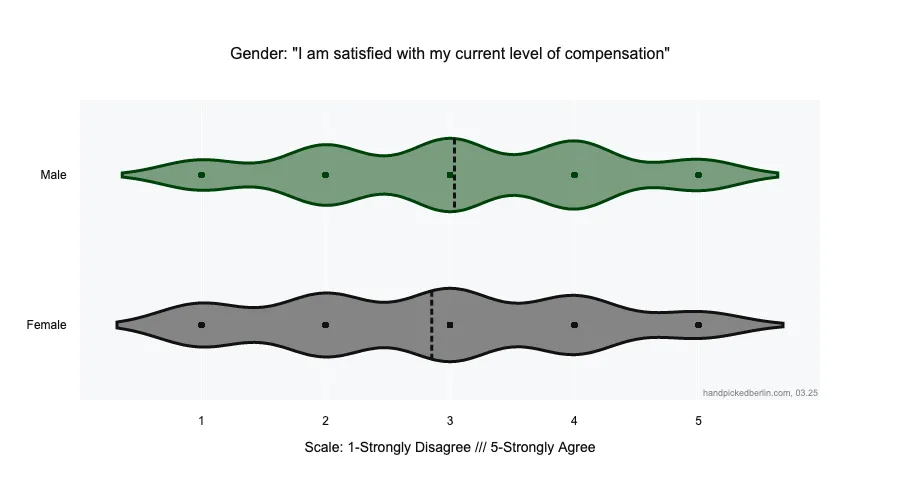
The dotted line on the following violin chart shows the average on the 1-5 Likert scale, where section width corresponds to response frequency.
Is salary satisfaction different for men and women?
Men continue to report higher satisfaction with their compensation than women (3.04 vs 2.85), with the gap widening slightly compared to last year (3.12 vs 3.05). ⤴
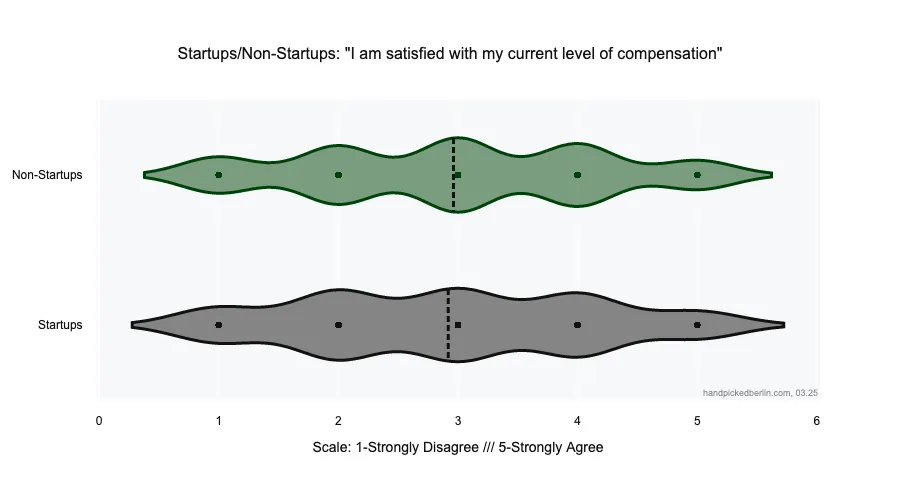
Are startup employees less satisfied with their pay?
Pay satisfaction remains lower in startups (2.92 vs 2.96 for non-startups), though the difference has narrowed compared to last year (2.98 vs 3.15). ⤴
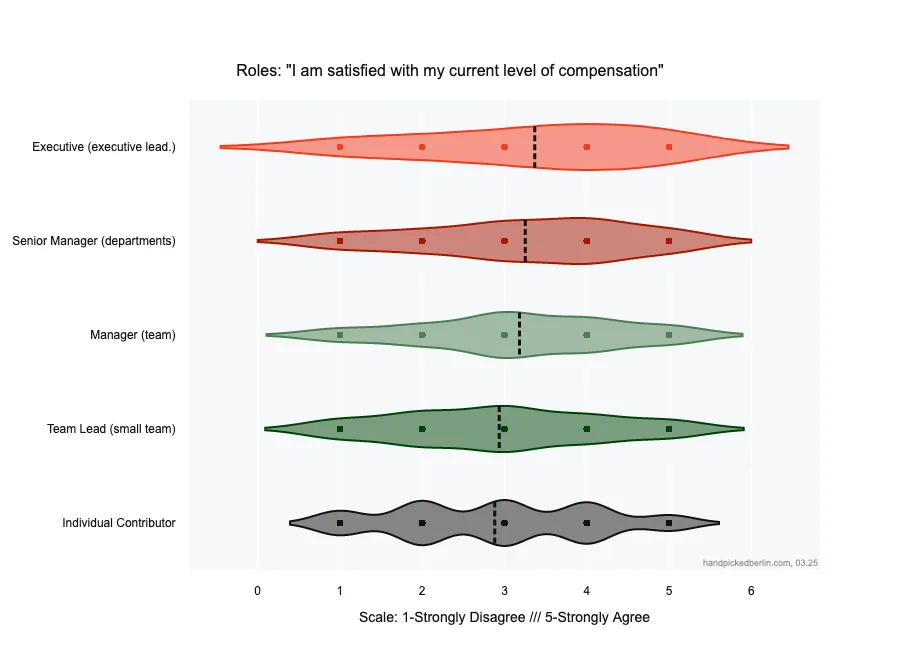
How does salary satisfaction vary by role?
The salary satisfaction hierarchy remains intact, confirming that discontent indeed trickles down from the top. Executives maintain their position as the most satisfied (3.37 with 30 respondents). The pattern continues with Senior Managers/Directors (3.25, 27) and Managers (3.18, 166) reporting above-average satisfaction.
Team Leads continue to be the most dissatisfied managers (2.94, 188), virtually unchanged from last year. Acting as a buffer isn’t easy! Individual contributors have the lowest average (2.88, 1269). ⤴
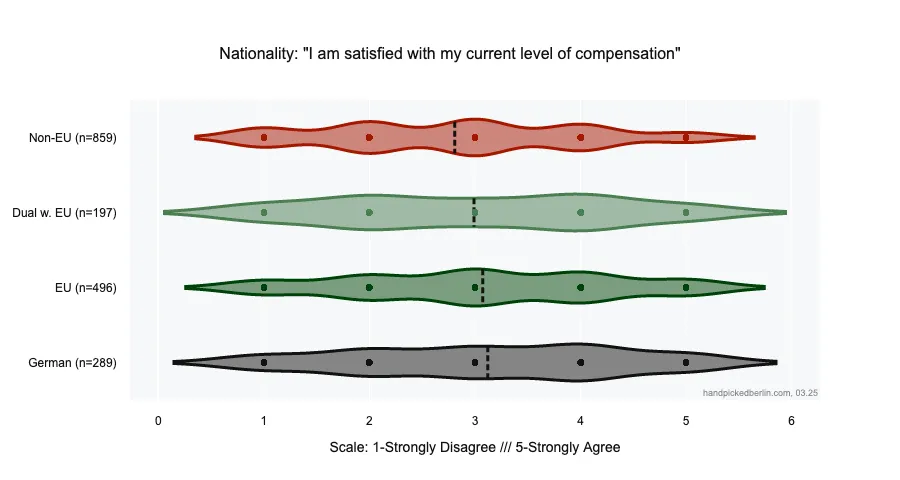
How does salary satisfaction vary by nationality?
German citizens show slightly higher satisfaction levels (average 3.12) than Non-EU workers (2.81), despite Non-EU workers typically earning higher salaries. ⤴
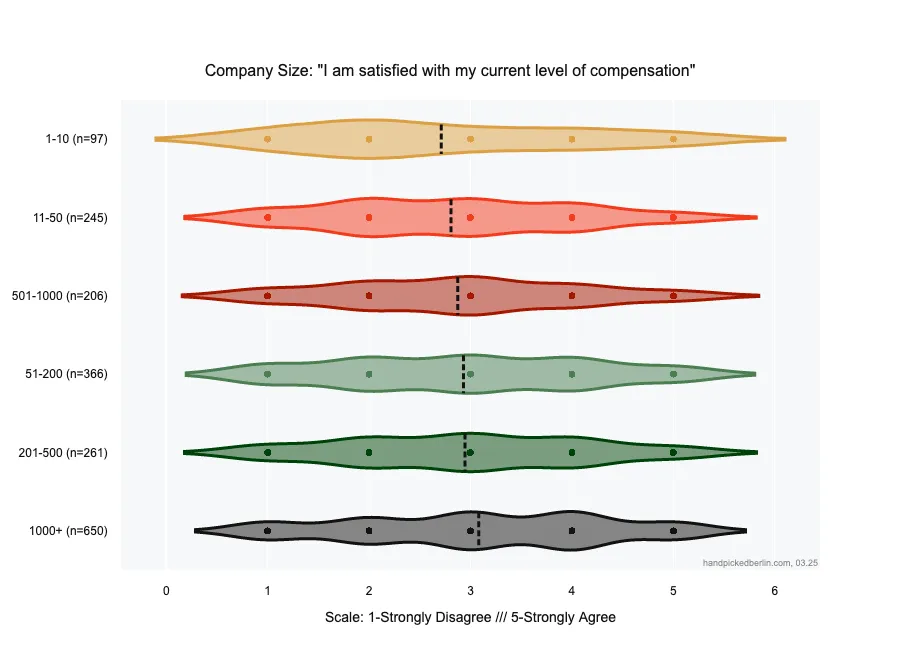
How does salary satisfaction vary by company size?
The larger the company, the more satisfied the employees. The only slight exception is in 501-1000 (2.87) and 201-500 (2.95) buckets. ⤴
How many plan to change jobs in 2025?
Job mobility is high, with over 30% of respondents saying they’re likely to switch jobs in 2025. ⤴
What are the typical working hours?
The traditional 40-hour work week dominates with 85.12% (1,527) of all respondents reporting this contract type. The data shows some adoption of alternative schedules, with the four-day work week (32 hours) emerging as the second most common arrangement at 2.68% (48 respondents). Other common variations are 35-hour (1.78%), 39-hour (1.73%), 20-hour (1.39%) and 38-hour (1.11%) work weeks. ⤴
How common are raises, bonuses and overtime pay?
Raises and bonuses were less common than expected — and even rarer for equity. We’ve collected detailed figures on this and plan to explore more in future content and community discussions. ⤴
Thanks for reading! You can send your feedback or questions and subscribe to the newsletter to get more future insights.
Frequently asked questions
What is the average tech salary in 2025?
The average gross annual salary increased by 1.46% to €78,574.25, while the median remained unchanged at €75,000 compared to 2024.
What is the median salary for tech workers in 2025?
The median salary is €75,000, showing no change from 2024.
How much does experience increase earnings in the tech sector?
Substantial increases occur in early career stages: 1-2 years (€55,000, +30.9%), 3-5 years (€60,000, +9.1%), 6-10 years (€75,000, +25%), and 11-15 years (€86,000, +14.7%).
Which roles in tech have the highest salaries?
Engineering Leadership roles lead with €110,000 median, followed by SRE & Infrastructure specialists (€101,000), Executives (€97,500), Backend Engineering (€95,000), and Security & Cybersecurity (€94,000).
What industries offer the best compensation?
Top 3 with more than 100 respondents were: Finance & Insurance (€83,000), Technology/Software Development (€80,000) and Retail & Wholesale Trade (€79,250).
How large is the gender pay gap in the tech industry?
The gap has widened to over 20% with women earning a median of €66,000 compared to €83,000 for men. Even controlling for experience and role, the gap remains at 14.9%.
Does German language proficiency affect tech compensation?
Surprisingly, it doesn’t help. Non-German speakers often earn more than fluent speakers, with C1 level speakers showing the lowest compensation.
Do startups pay more or less than established companies?
Both have identical €75,000 median salaries, though startups show a slightly higher average salary (€80,424 vs €78,041).
How does company size affect salary levels?
Clear progression exists as companies grow: 1-10 employees (€52,000), 11-50 (€65,000), 51-200 (€73,500), 201-500 (€78,000), and 1000+ (€80,000).
Does nationality impact earnings potential?
Yes, with Non-EU citizens earning the highest (€78,000 median), followed by dual EU citizens (€76,000), German citizens (€71,000), and other EU citizens (€70,000).
What percentage of tech workers plan to change jobs this year?
Nearly one-third (30.82%) are likely or very likely to change jobs in 2025.
How common are bonuses and equity compensation in tech companies?
Most respondents (59.13%) received neither bonus nor equity, 20.33% received only a bonus, 14.96% received only equity, and 5.58% received both.
Are remote work opportunities increasing or decreasing?
Remote work decreased, with remote respondents dropping from 13% to 10.35%.
What is the educational background of most tech workers?
Highly educated professionals dominate, with 49.27% holding Master’s degrees and 36.85% holding Bachelor’s degrees.
How does education level affect earning potential?
It generally doesn’t. Respondents without higher education earn more (€77,000 median) than the highly educated average (€75,000). But the sample for workers without higher education is significantly smaller.
What are the typical working hours in the tech industry?
The traditional 40-hour work week dominates with 85.12% of respondents.
How common are raises and overtime pay?
38.58% received no raise, while 35.34% received modest 1-5% increases. 67.8% received neither payment nor flex-time for overtime.
What salary can software engineers expect?
General Software Engineers earn a median of €84,000, with specialized roles ranging from €49,500 (Web Development) to €110,000 (Engineering Leadership).
How satisfied are tech workers with their compensation?
Satisfaction varies by demographics and roles, with executives most satisfied (3.37/5) and individual contributors least satisfied (2.88/5).
What is the pay difference between men and women with equivalent experience?
The controlled gap is 14.9% when accounting for identical roles and experience levels.
Appendix
Noticed mistakes or have questions? Do let me know.
Why (mostly) median salary and not average?
Comparing median salaries offers a more accurate representation of what a typical individual earns because the median is less affected by outliers. Few top earners can disproportionately skew earnings, so the average salary can appear misleadingly high. The median is the middle value and more realistically reflects the typical income.
Notes on data cleaning
We processed the data extensively to get it to the final form. For example:
- Data Cleaning and standardisation: We removed timestamps from Google, randomised the order, corrected common typos and removed several variations of job seniorities; we rounded the salaries, bonuses and equity up or down to the closest 500. We did our best so that job titles were consistent throughout the dataset.
- Filtering and Privacy: We removed respondents who are not working in Berlin or for a Berlin-based organisation. We anonymised industries that appear too infrequently (less than or equal to five times) by labelling them as “Prefer not to say”.
- Job Classification: We categorised job titles based on keywords associated with different job categories. Job titles that don’t match any predefined category are classified as “Other.”
Mandatory questions
- Are you currently employed in Berlin or by a Berlin-based organization?
- Gender
- Age
- Type of organisation
- Industry
- Job Position/Title
- Total annual gross salary in EUR (before taxes and deductions)