
2026 overview · Check your salary · Salary by role · Company Benchmark
Summary of key findings
- Median full-time salary climbed to €80,000, up 4.6% from €76,500 in 2025. The average rose to €83,949 (up 3.5% from €81,072).
- Women still earn 17.6% less than men at the median — €70,000 vs €85,000. That’s a slight narrowing from 2025’s 20%+ raw gap, but the gap is still the gap.
- Engineering leadership tops the table at €115,000, followed by Legal & Compliance (€99,000) and AI & Machine Learning Engineering (€95,000). General software engineering sits at €88,000.
- 33.0% are likely or very likely to change jobs in 2026. That’s ~2pp more vs 2025’s 30.82%, a mild uptick despite the tougher hiring market. Compensation is the dominant trigger by a wide margin (45.2%).
- Most of Berlin tech would leave if pushed back to the office. 68.8% of at-risk respondents would either leave within six months or start job-hunting if their employer mandated 4+ office days. (At-risk = not already fully on-site or fully remote; n=3,615.)
- 61.2% are worried about AI affecting their job security, even as 87.5% use AI tools personally and 84.7% report it has made them more productive. Only 7.6% of companies have no clear AI policy.
Salary figures cover full-time employees only (n=4,138). 2025 comparisons are recomputed on the full-time subset of last year’s dataset (n=1,700), so the published 2025 headline (€75,000 median, €78,574 average, mixed population) isn’t directly comparable. This was also noted in last year’s report. See methodology notes.
If this report is your thing, the newsletter is where it comes from. Two editions a week on Berlin’s tech, jobs, and startup scene, read by 14,000+ subscribers.
Table of contents
About this report
The Berlin Salary Trends survey is the largest tech salary survey in Berlin. The 2026 edition collected 6,240 raw submissions (4,848 completed + 1,392 partial). The survey was open both English and German in March 2026.
After cleaning, deduplication, and salary validation, 4,627 cleaned responses are included in this report, which is a 151% increase on last year’s 1,845. Of those, 4,138 full-time salary data points is used in pay analyses. Job titles were classified into role families using a combination of automated matching and manual review.
The jump in responses was also made possible by two new partners in 2026: Ravio (benchmarking) and Factofly (independent work). Their sponsorship funded a dedicated marketing budget for data collection which was not possible before. Both partners are introduced below.
New in 2026: This edition adds questions on return-to-office policies, salary negotiation, benefits, office days, and AI adoption. These are the areas missing from Berlin’s tech compensation data or only available through expensive enterprise surveys. The 2026 survey also added a department question and more granular leadership levels.
For the first time, this report includes comparative benchmark data from Ravio, our benchmarking partner, giving Berlin’s numbers context against broader European markets. All Ravio data is clearly labelled and visually distinct.
About Ravio — Benchmarking partner

A new standard of benchmarks for confident compensation.
Wrong compensation decisions cost companies millions – lost hires, wasted budgets, top talent walking out the door. All because they’re navigating with a broken compass: inaccurate benchmarks. With payroll accounting for over 70% of operating costs, businesses can’t afford to get compensation wrong.
That’s why 1,500 companies – such as Leapsome, DeliveryHero, and Scout24 – trust Ravio as the new standard for compensation benchmarking.
It’s not about yesterday’s survey data or piecing together job postings, salary sites, and crowdsourced reports with AI. Ravio benchmarks are powered by live data pulled directly from company HR systems, expertly mapped and levelled by our compensation specialists, and backed by a robust methodology you can defend in any boardroom.
You don’t just get numbers – you get market intelligence that matters: real-time pay trends to win hires, insights to plan smarter, and pay positioning to keep your best people.
About Factofly — Independent work partner

Most people doing project-based work in Germany didn’t sign up for the admin that comes with it. Factofly takes it off your plate.
You bring the client and do the work. For each project, Factofly employs you on a fixed-term basis — handling contracts, payroll, taxes, and contributions. When the project ends, so does the employment. None of the freelancer admin, no Scheinselbständigkeit risk for you or the client.
Used by designers, developers, consultants, creatives and over 100 other professions across Europe. Trusted by teams at Disney, Publicis, and Mediacom.
Report limitations
This survey is voluntary and self-selected. It is not a random and statistically relevant sample of the Berlin tech workforce. The dataset reflects the reach of the Handpicked Berlin newsletter and its extended community, which means certain groups are overrepresented and others are underrepresented. These patterns are consistent with prior years.
Who the survey reaches. We exclude students and everyone not working in Berlin or for a Berlin-based company. It does not require working in tech. In practice, the survey captures Berlin’s tech and tech-adjacent knowledge-worker market. This means tech workers at tech companies, tech workers embedded in non-tech industries (finance, media, healthcare, education, retail), and white-collar professionals (product, ops, design, finance, HR, legal) who found the survey through tech-media channels. It systematically does not reach trades, retail-floor, manual, gig, or hourly workers. Every “Berlin tech salary” claim in this report should be read as “salary in Berlin’s tech and tech-adjacent knowledge-work market.”
Who is overrepresented:
- Engineering and technical roles (~36% of respondents)
- International professionals (79% report a non-German primary citizenship, vs ~25% in Berlin’s general population)
- Men (59% of respondents)
- Mid-career professionals (80% are aged 25–39)
What this means: The dataset is strongest for international tech professionals in Berlin, the audience it’s designed to serve. It is less representative of German-speaking professionals, non-technical roles, and early-career or late-career workers. Smaller departments (HR, Legal, Finance) have lower sample sizes and their data should be treated as directional.
Help us fix the skew next year. Sign up to be reminded when the 2027 survey opens → especially if you’re in an underrepresented group above.
How salary data is scoped:
- All salary figures are gross annual salary for full-time employees
- Part-time respondents (4.8% of the sample) are excluded from salary analyses but included in all other sections
- This avoids part-time salaries pulling medians down and misleading anyone benchmarking a full-time salary
How we handle small samples:
- Cross-analyses are only shown where the subgroup has n ≥ 30 respondents
- Below that threshold, categories are collapsed into broader groups or the analysis is omitted entirely
- Sections based on samples of 30–50 carry a “directional data” note
- Every chart shows the sample size it’s based on
How to read this report:
- Use median values rather than averages, because medians are less affected by outliers and high earners pulling the number up
- Compare within similar experience brackets, company sizes, and roles rather than against the overall figures
- Look at sample sizes before drawing conclusions from any subgroup
For detailed methodology, see Notes on methodology and data cleaning.
What are the average and median salaries?
The median full-time Berlin tech salary is €80,000, up 4.6% from €76,500 in 2025 (FT-recomputed). The average sits at €83,949 (n=4,138 full-time employees).
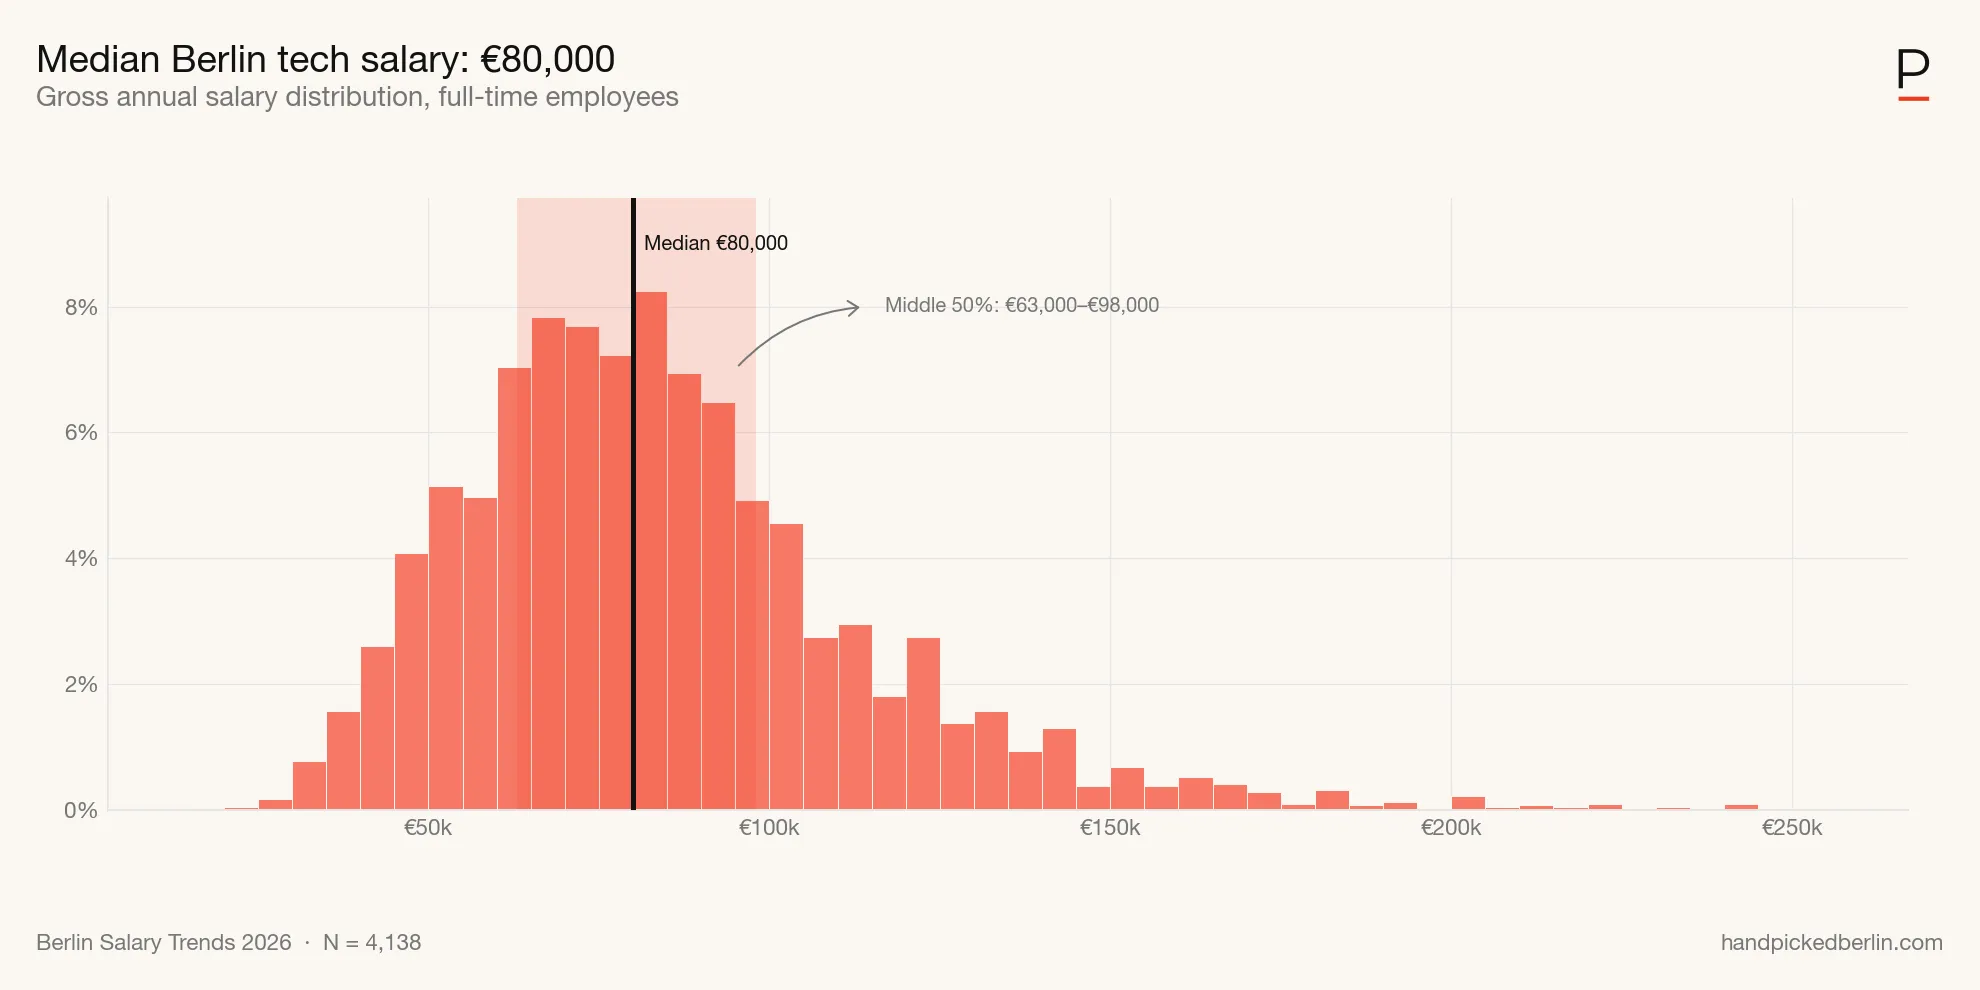
The bulk of Berlin tech salaries cluster between €60,000 and €100,000, with a long right tail of high earners that pulls the average (€83,949) about €4,000 above the median. That small gap of average above median reflects a modest right tail on the histogram: a visible but limited group of senior and leadership roles in six figures, while the typical full-time worker earns around €80,000.
How does Berlin compare to wider Europe? Ravio runs continuous compensation data from 1,500+ companies across European tech. At the median, Berlin essentially matches Europe across executives (€156,100 vs €151,110). It gets interesting at the employee level: Berlin Managers earn €100,300 against a European median of €88,895. Similarly, Professionals earn €73,000 against a European median of €63,100. Employees in Berlin earn in the top end compared to Europe.
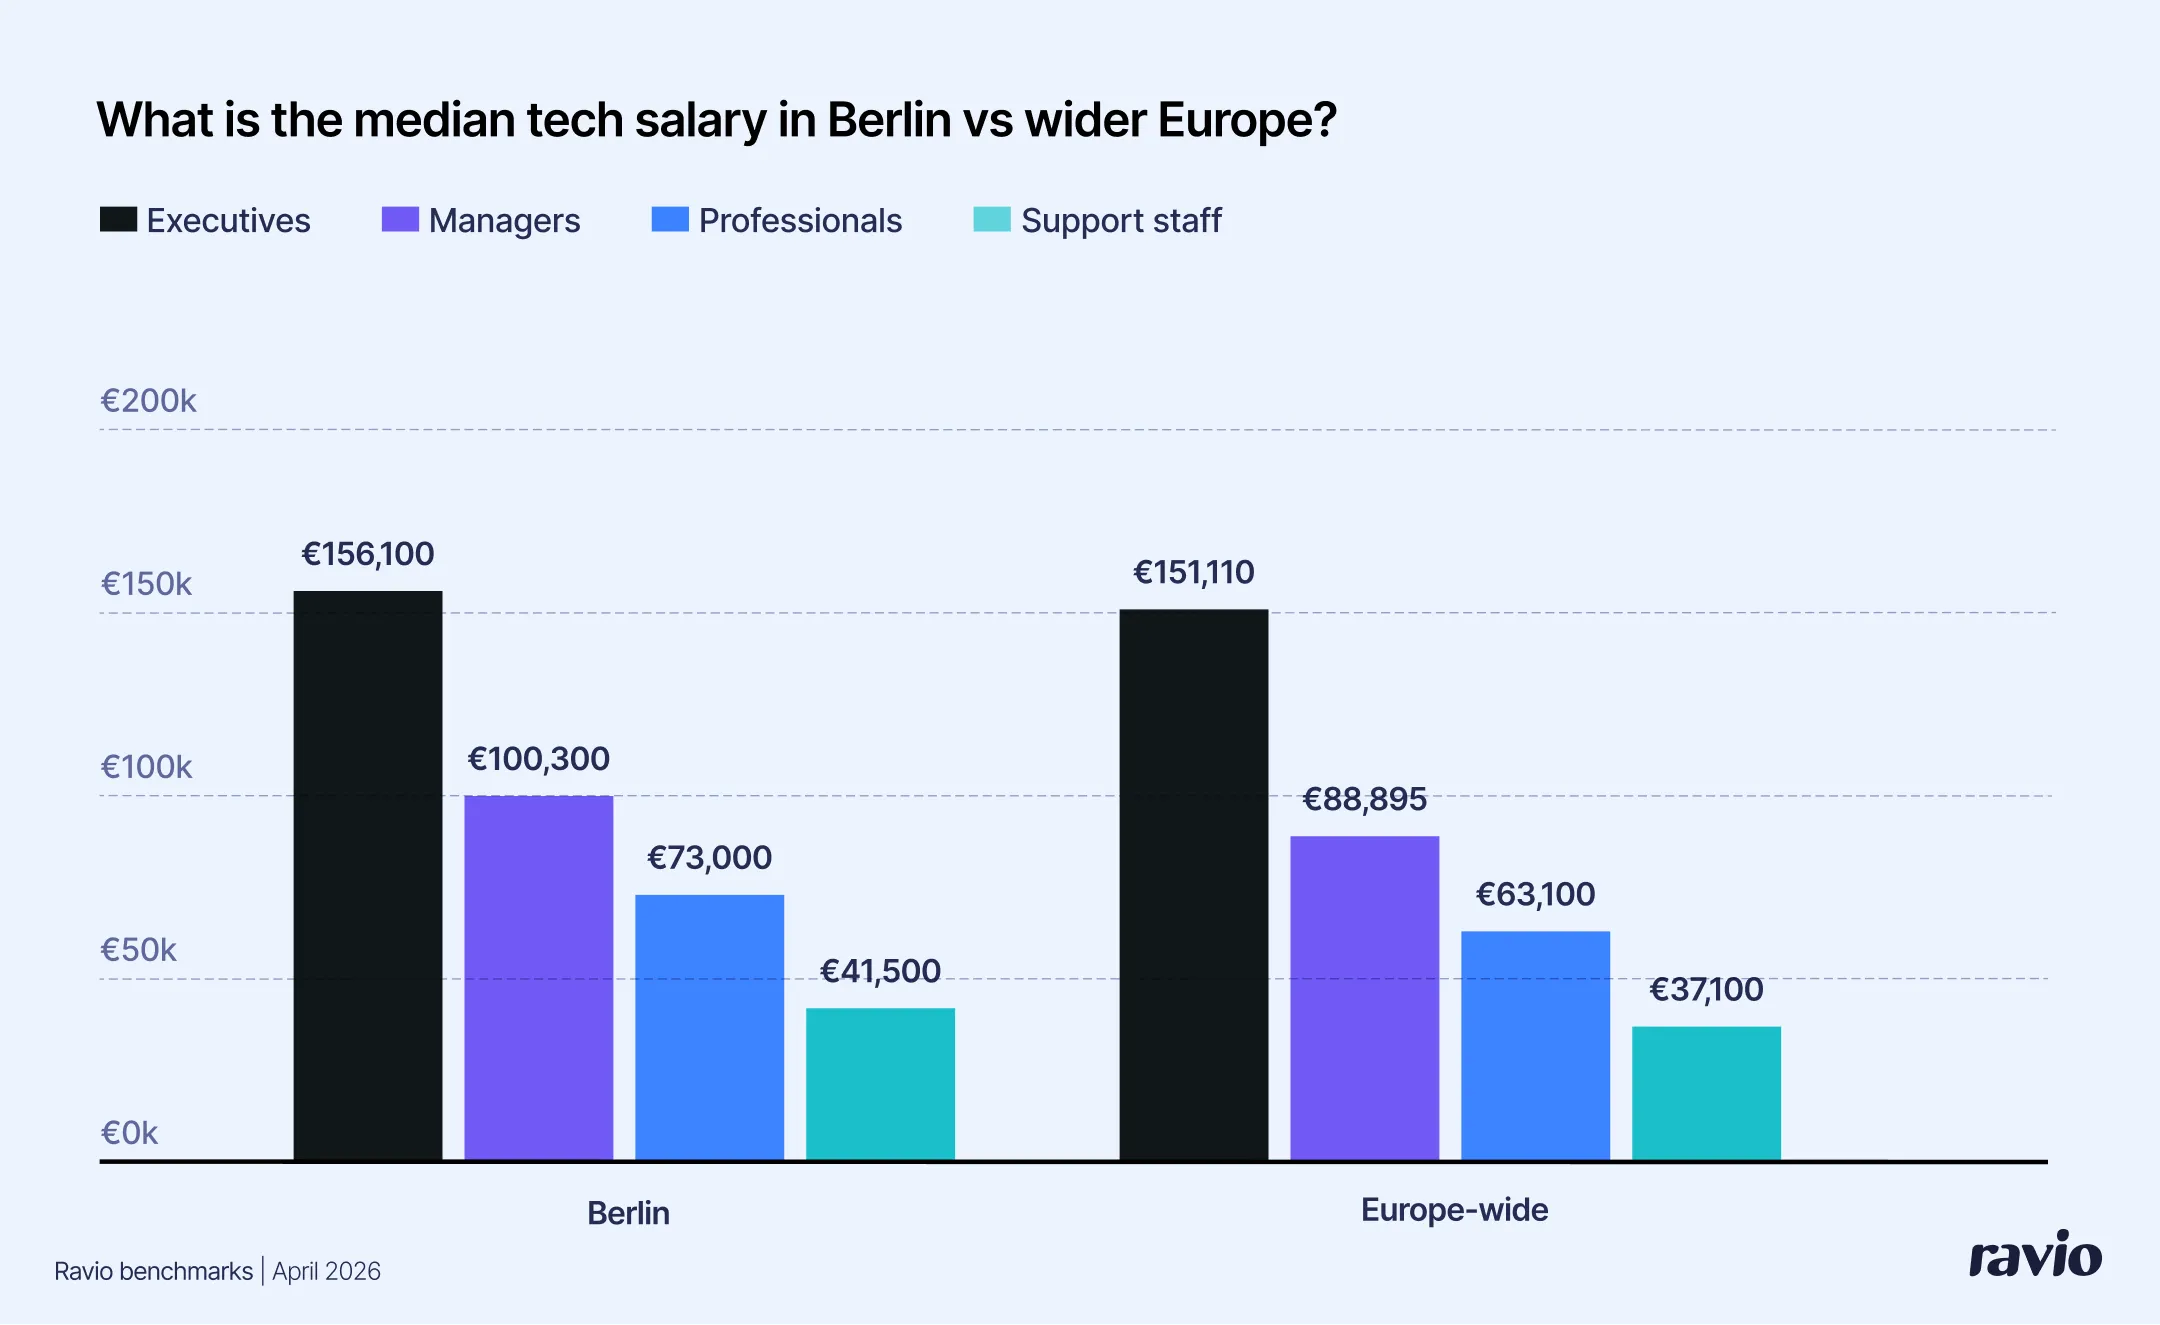
Ravio’s methodology differs from the survey: Ravio pulls live data directly from company HRIS systems and levels roles into a standardised framework, so absolute numbers won’t line up exactly with the survey medians elsewhere in this report.
How much does experience increase salaries?
Salary climbs steadily with experience, but the curve isn’t linear. The biggest single jump comes between 3–5 years (€64,000) and 6–10 years (€80,000). That’s a €16,000 senior lift.
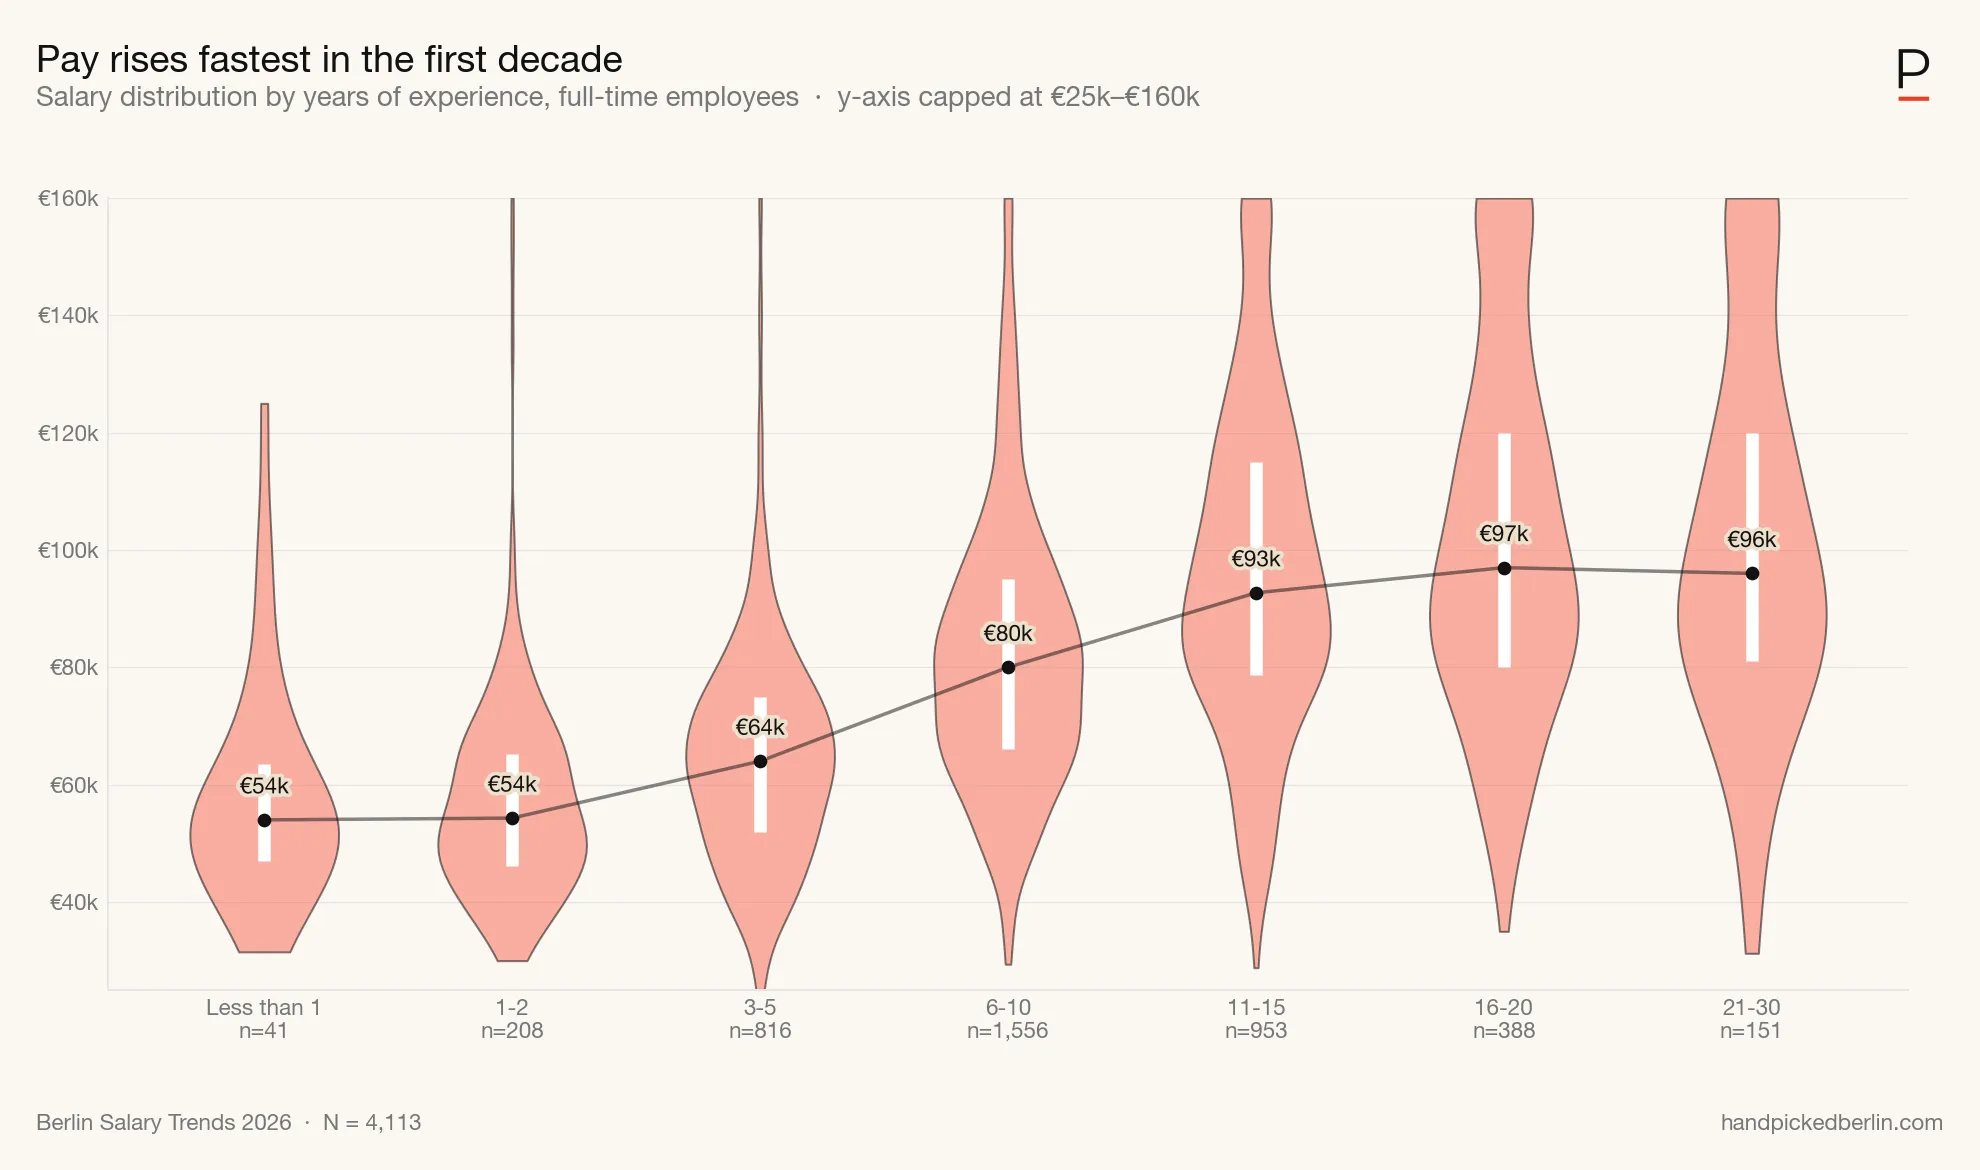
Medians by band: 1–2y €54,300 · 3–5y €64,000 · 6–10y €80,000 · 11–15y €92,700 · 16–20y €97,000 · 21–30y ~€96,000.
After that, growth slows: 11–15 years gets you to €92,700, and the curve flattens above 16 years (€97,000), where most additional gains come from moving into leadership rather than time in seat. Variance also widens with seniority. The senior bands include more managers and are more spread out.
In European context, Berlin tracks slightly above the European median at every level, for both IC and management tracks. The Ravio overlay has two tracks: P-track (individual contributors, P1–P6) and M-track (managers, M1–M5).
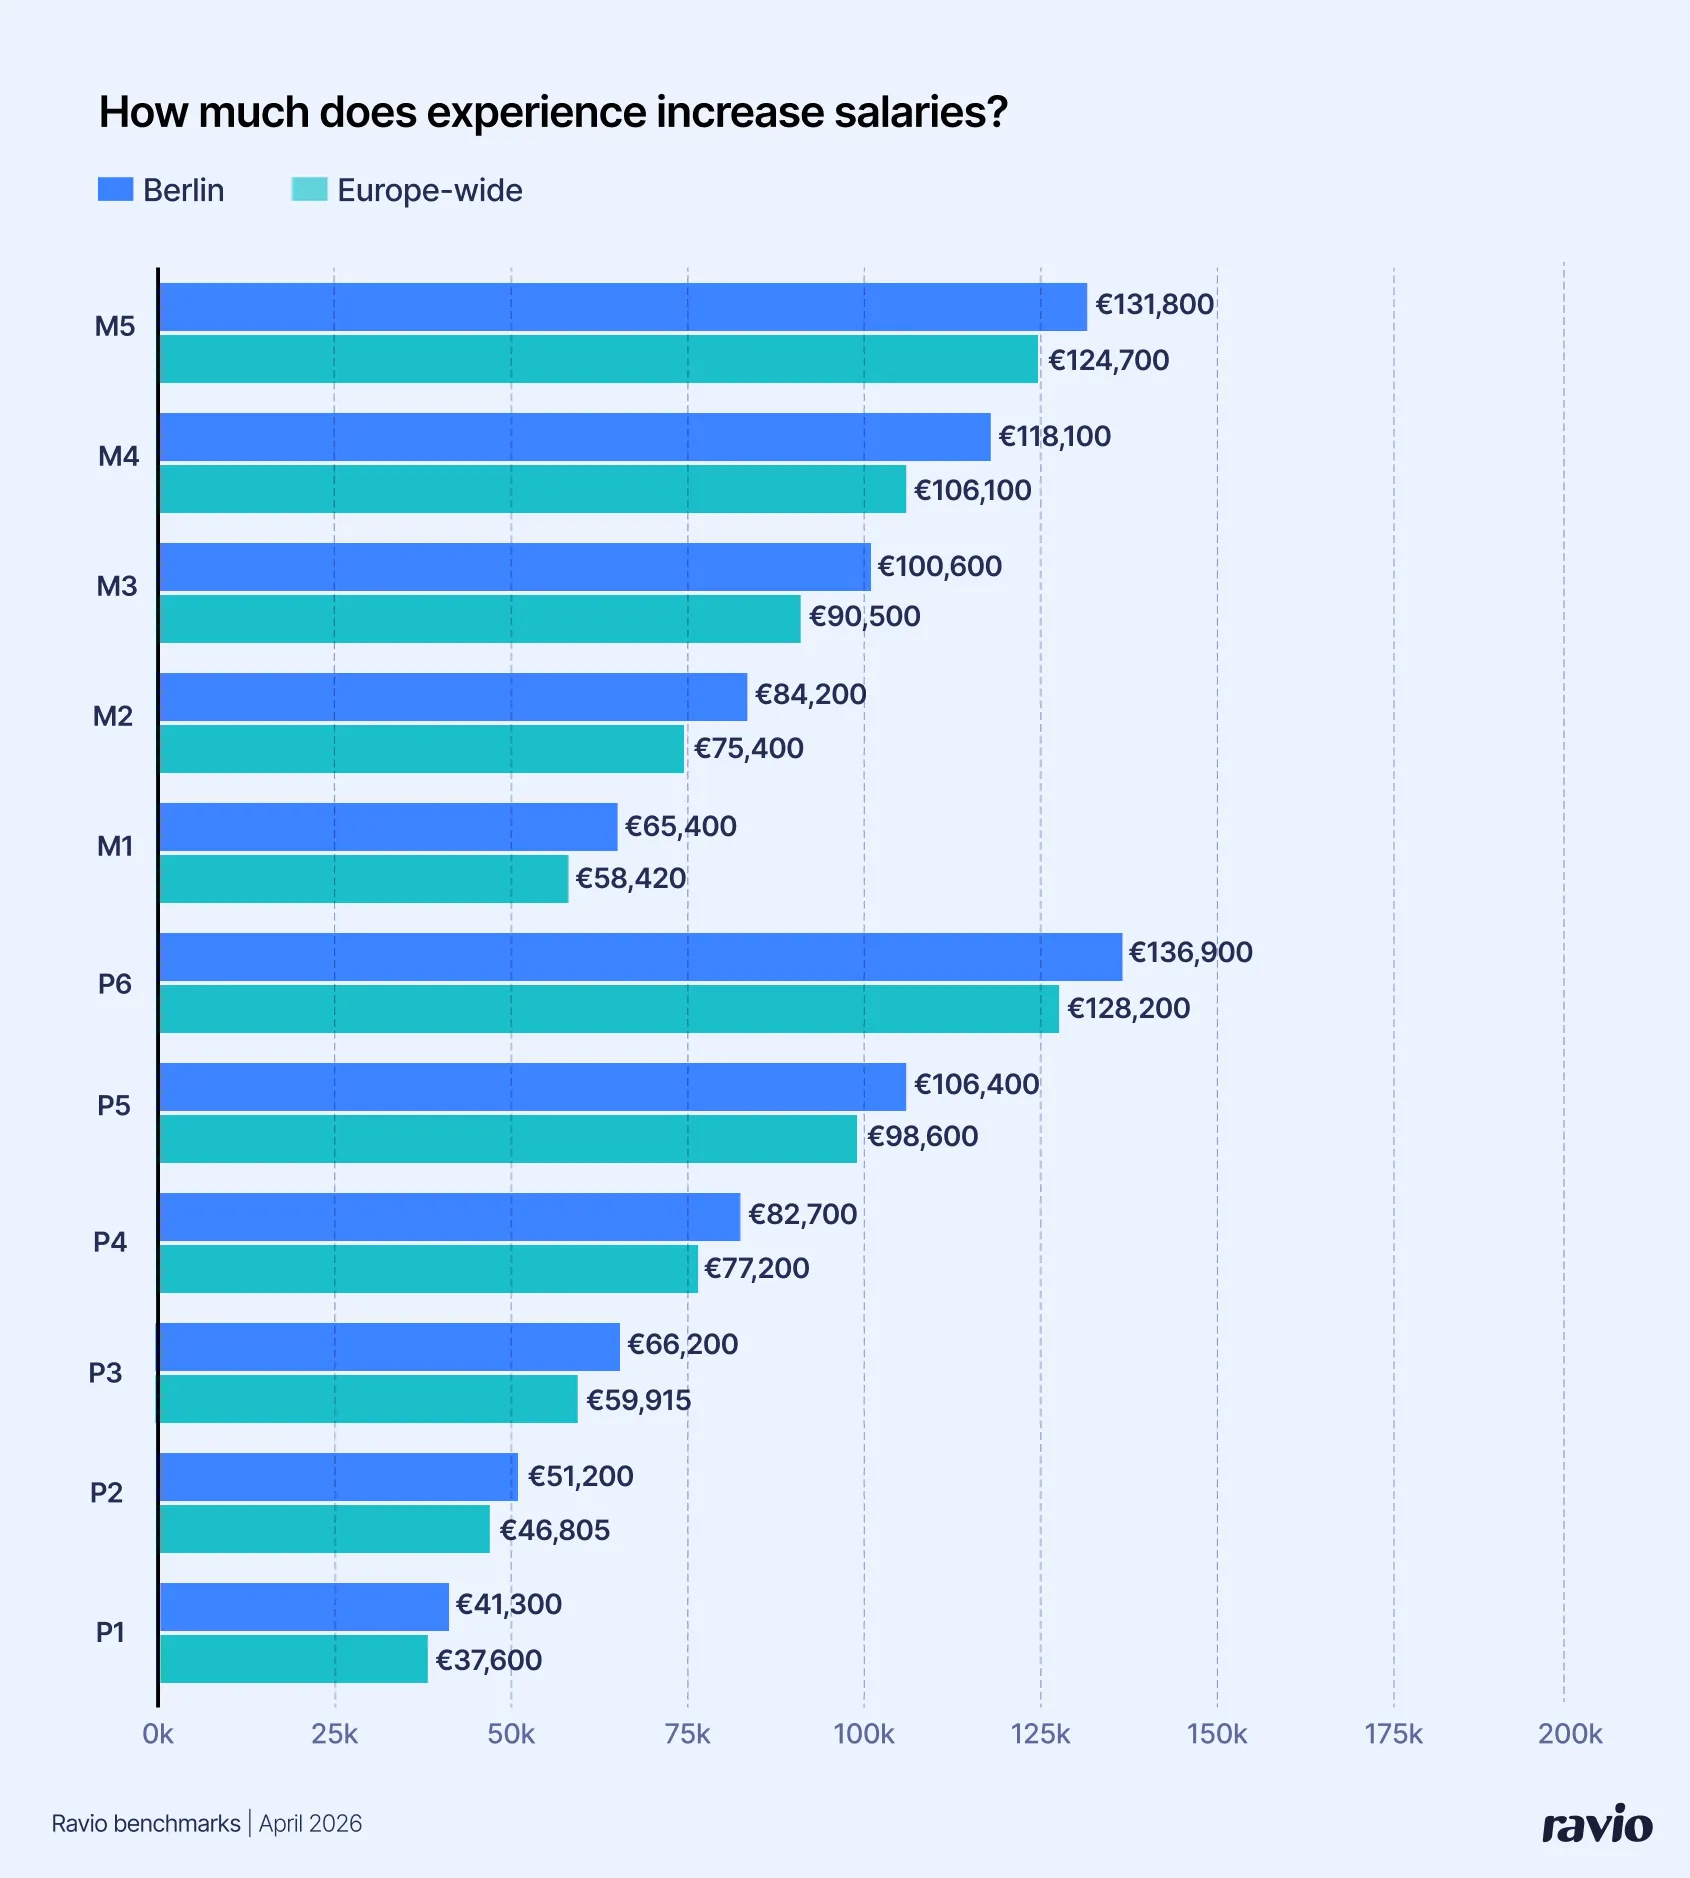
The chart uses Ravio’s job-levelling framework: P = Professional (individual contributors, P1–P6), M = Management (M1–M5). See Ravio’s framework →
Which roles pay the most and least?
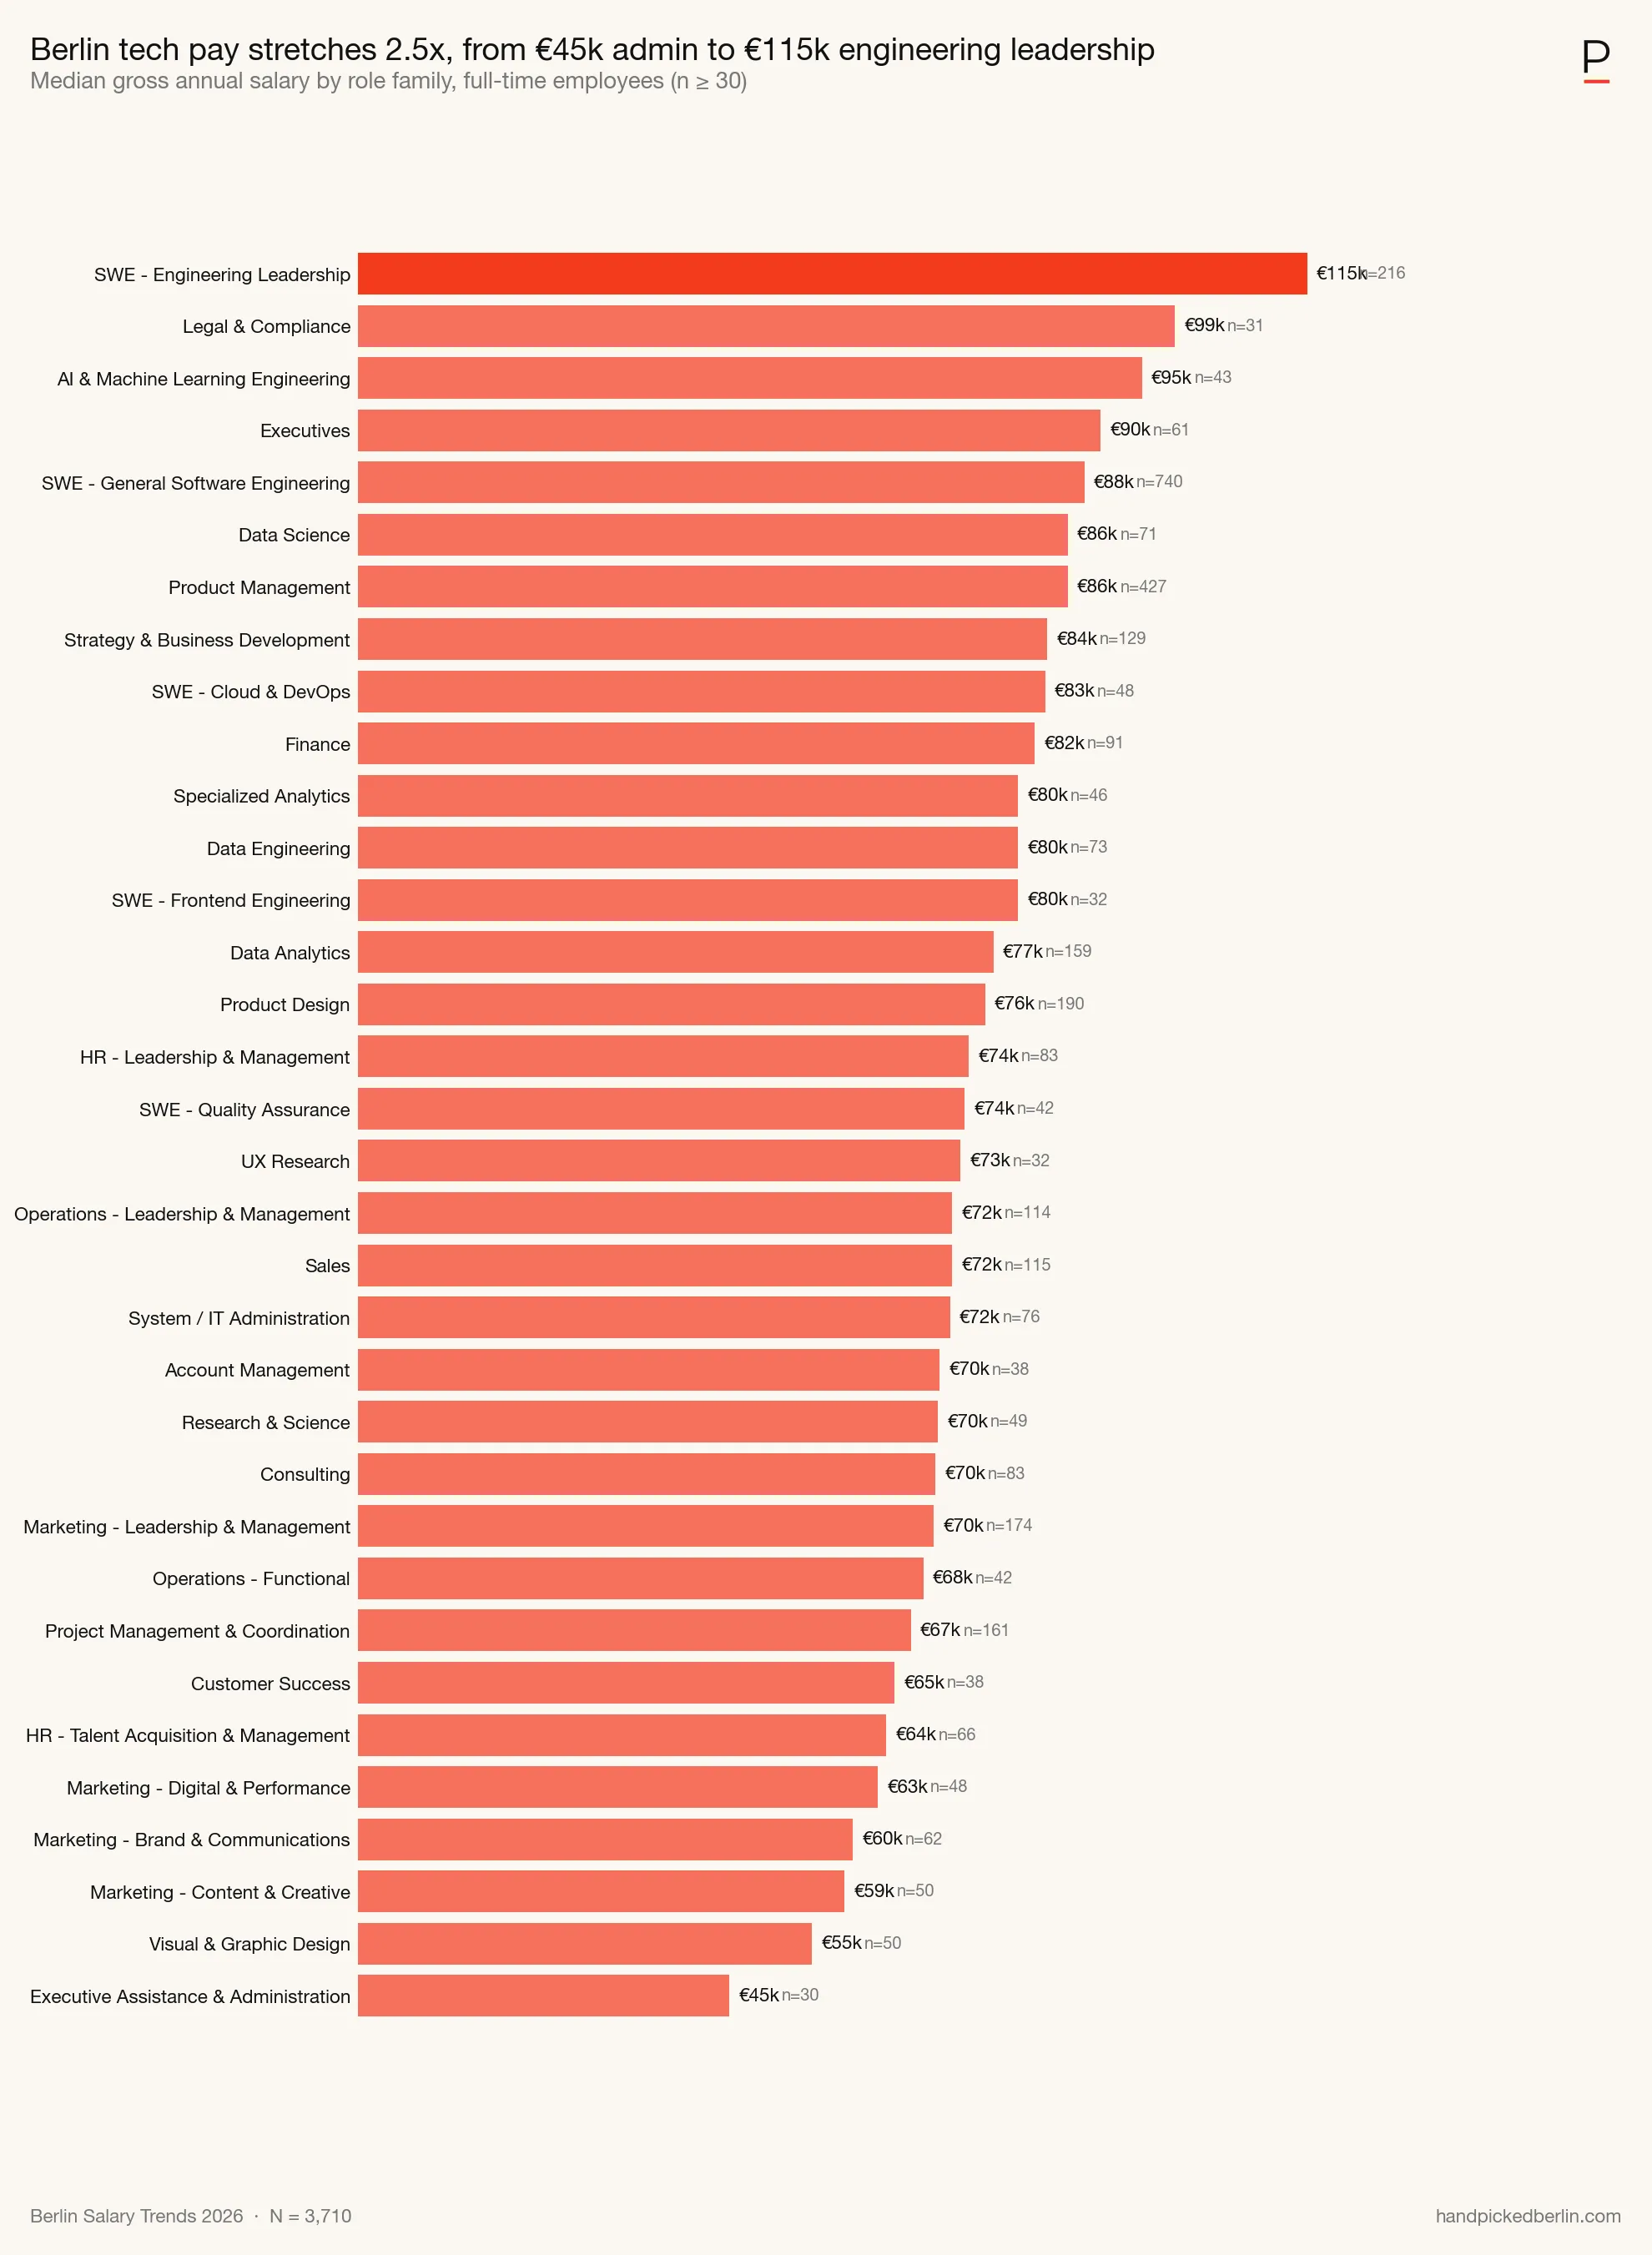
Engineering leadership tops the table at €115,000, followed by Legal & Compliance (€99,000) and AI & Machine Learning Engineering (€95,000). AI is a new group, added in 2026.
One caveat on the top line: Engineering Leadership is a management role family (engineering managers, heads of engineering, VPs, CTOs), not individual contributors. The IC comparison is General Software Engineering at €88,000, which is still above most other role families. Legal, Compliance, and AI roles and other groups include ICs and leadership mixed.
At the other end, Visual & Graphic Design (€55,000) and Executive Assistance & Administration (€45,000) anchor the bottom. The spread from top to bottom is roughly 2.5x.
| Role/job family | n | Median |
|---|---|---|
| SWE — Engineering Leadership | 216 | €115,000 |
| Legal & Compliance | 31 | €99,000 |
| AI & Machine Learning Engineering | 43 | €95,000 |
| Executives | 61 | €90,000 |
| SWE — General Software Engineering | 740 | €88,000 |
| Data Science | 71 | €86,000 |
| Product Management | 427 | €86,000 |
| Strategy & Business Development | 129 | €83,500 |
| SWE — Cloud & DevOps | 48 | €83,250 |
| Finance | 91 | €82,000 |
| Specialized Analytics | 46 | €80,000 |
| Data Engineering | 73 | €80,000 |
| SWE — Frontend Engineering | 32 | €80,000 |
| Data Analytics | 159 | €77,000 |
| Product Design | 190 | €76,000 |
| HR — Leadership & Management | 83 | €74,000 |
| SWE — Quality Assurance | 42 | €73,500 |
| UX Research | 32 | €73,000 |
| Operations — Leadership & Management | 114 | €72,000 |
| Sales | 115 | €72,000 |
| System / IT Administration | 76 | €71,750 |
| Account Management | 38 | €70,500 |
| Research & Science | 49 | €70,300 |
| Consulting | 83 | €70,000 |
| Marketing — Leadership & Management | 174 | €69,750 |
| Operations — Functional | 42 | €68,500 |
| Project Management & Coordination | 161 | €67,000 |
| Customer Success | 38 | €65,000 |
| HR — Talent Acquisition & Management | 66 | €64,000 |
| Marketing — Digital & Performance | 48 | €63,000 |
| Marketing — Brand & Communications | 62 | €60,000 |
| Marketing — Content & Creative | 50 | €58,950 |
| Visual & Graphic Design | 50 | €55,000 |
| Executive Assistance & Administration | 30 | €45,000 |
Base: n=3,710 — the same subset as the chart above. Full-time salary respondents (n=4,138) grouped into 34 role families with n≥30; excludes the “Other” catch-all bucket (n=63) and 21 smaller families (n<30, 365 respondents).
How do Berlin’s top roles look in European context? Software Engineers and Data Engineers in Berlin are doing particularly well. Ravio’s benchmark for the five highest-volume P3 roles (mid-level ICs in Software, AI, ML, Data Engineering, and Product Management) puts Berlin above the European median across all five. The gap is biggest in Software Engineering (Berlin €80,600 vs Europe €63,000, ~28% premium) and Data Engineering (Berlin €77,500 vs Europe €67,900, ~14% premium).
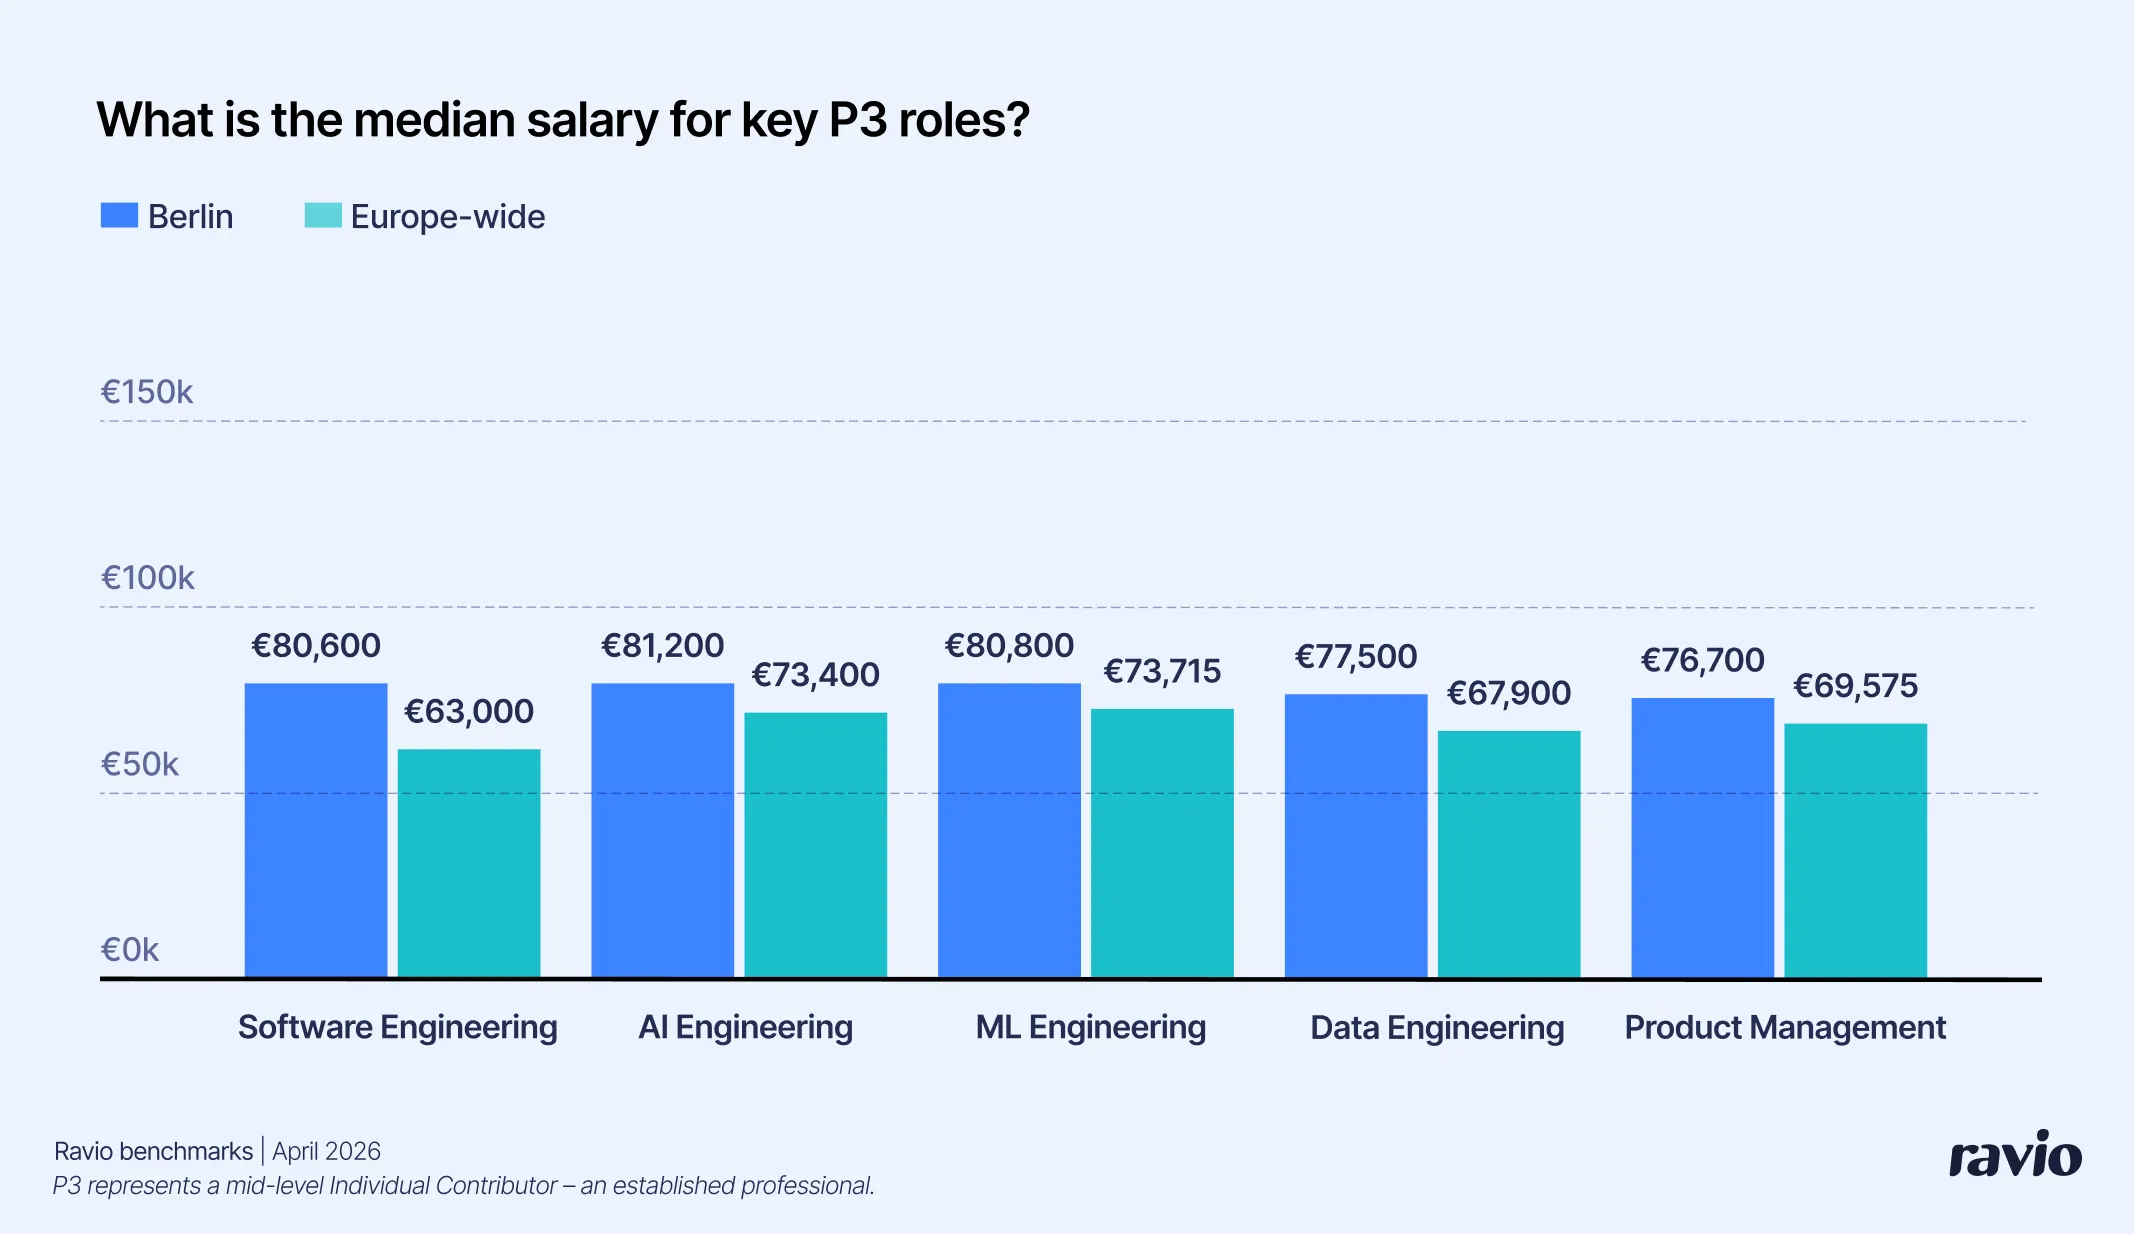
Ravio’s standardised P3 medians won’t match Handpicked’s role-family medians above, because the survey groups self-reported job titles into families across all seniority levels, while Ravio normalises specifically to the P3 mid-level IC band.
Want the full salary breakdown for your role — by seniority, experience, company size, and more?
Which industries offer the highest salaries?
Tech/Software (€85,000) and Finance & Insurance (€84,000) sit at the top.
If we look only at IC software engineers, the top-tier industries pay similarly: Finance (€88,000, n=101), Tech/Software (€85,000, n=601), and Retail & Wholesale (€85,000, n=38) sit within a few thousand euros of each other. But engineer pay isn’t flat across the whole economy: it drops to €74,000 in Healthcare (n=32) and €60,000 in Professional Services (n=19) — small samples, but the direction is consistent.
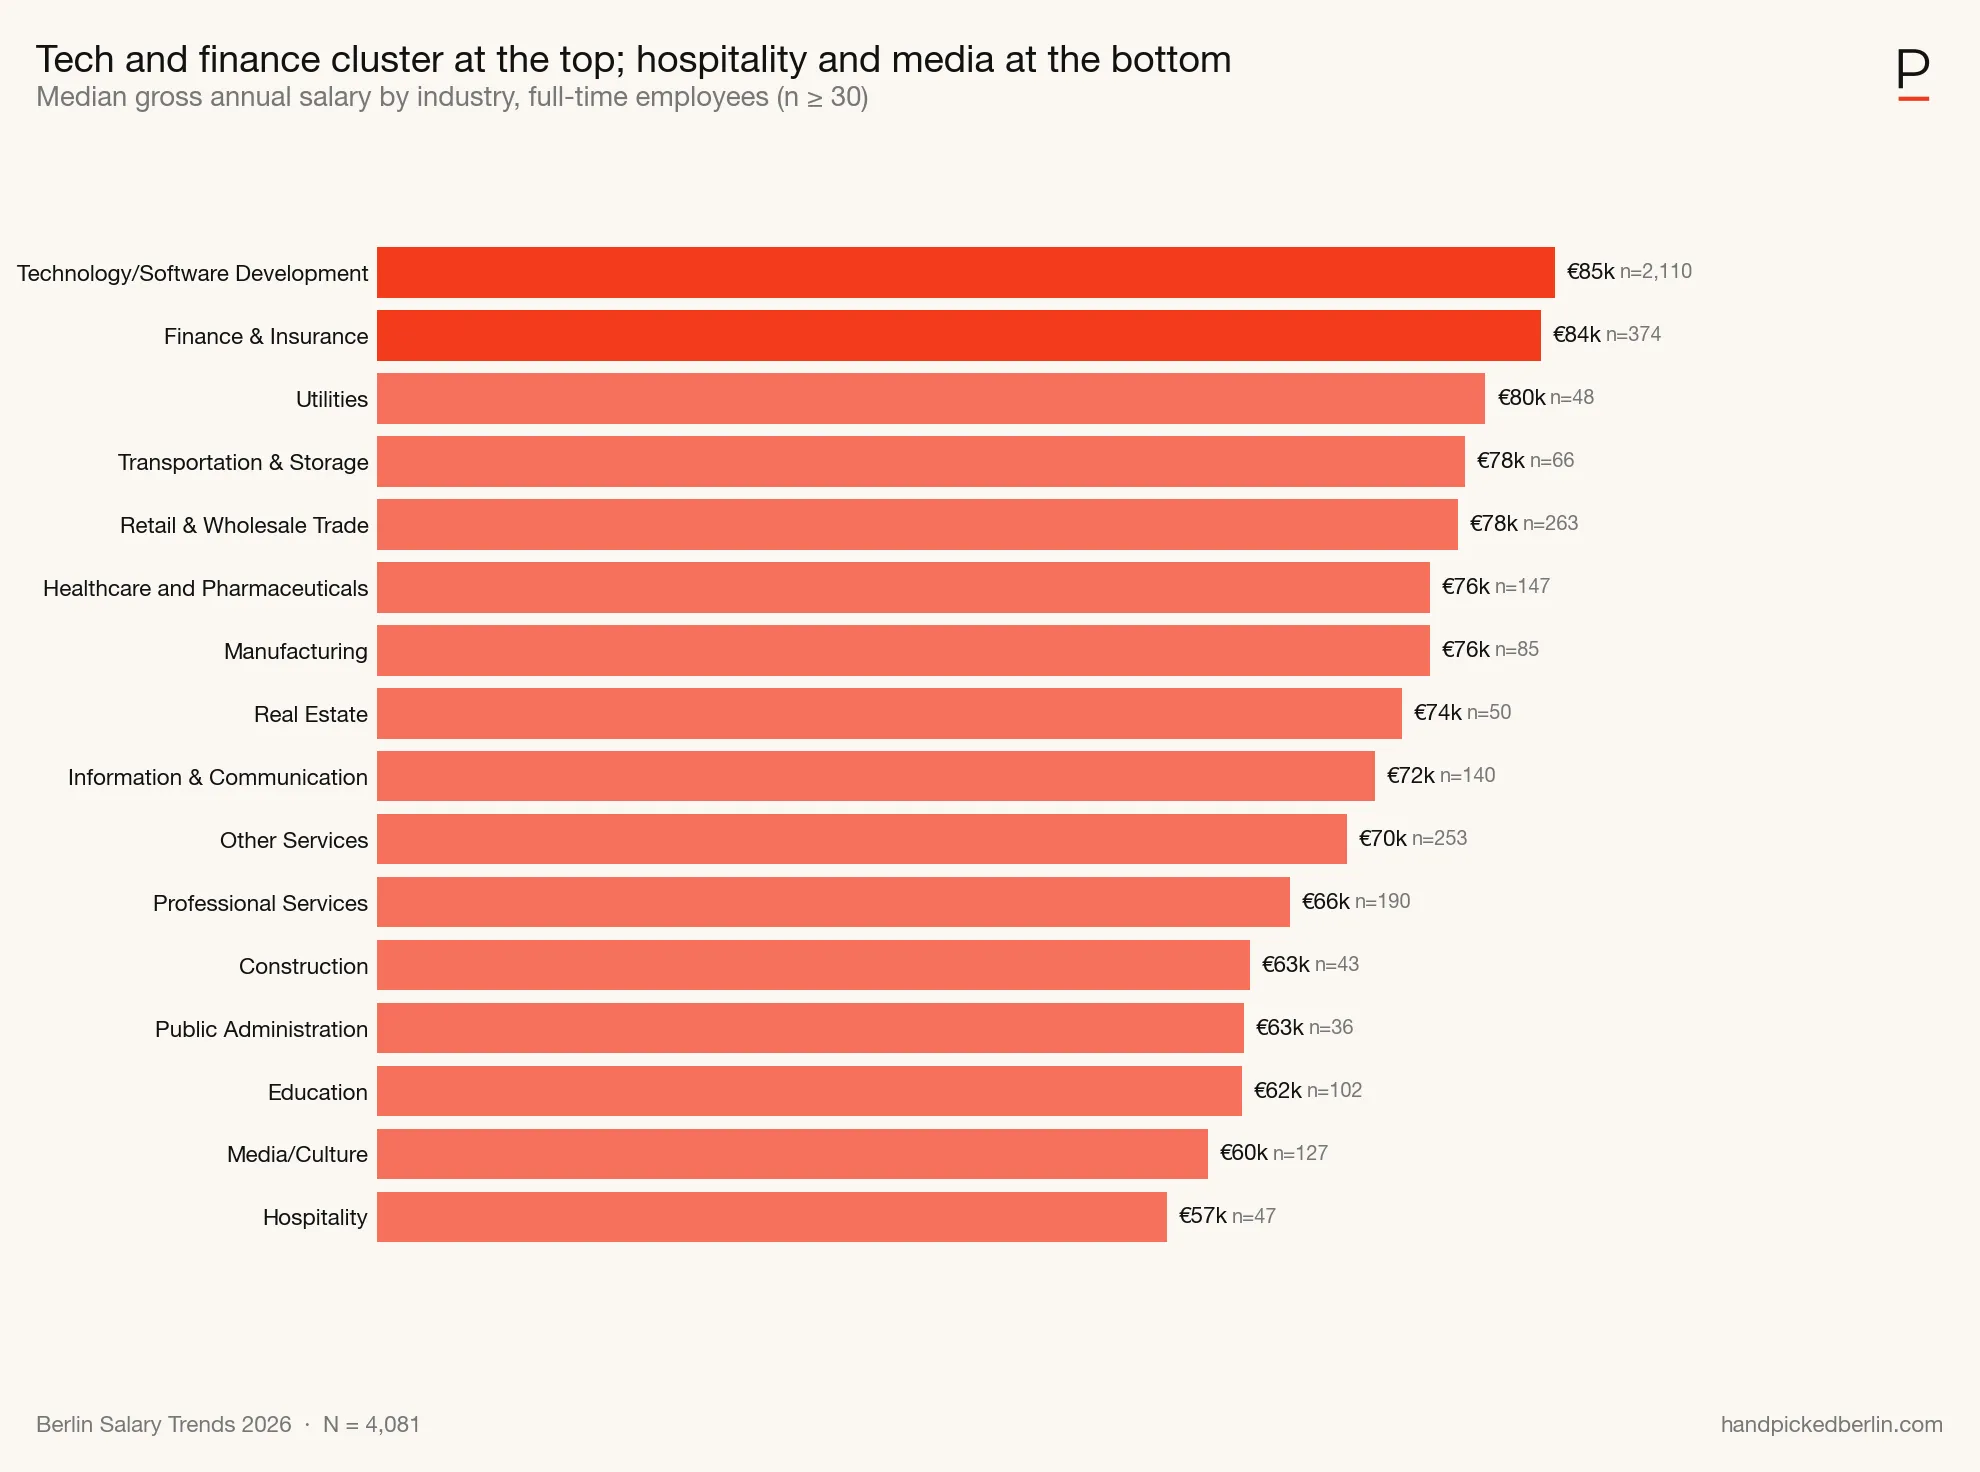
The bottom of the chart — Hospitality (€57,000), Media/Culture (€60,000), Education (€62,450), Public Administration (€62,600) — is partly a role-composition effect: Education and Public Administration are dominated by non-engineering roles (IC engineers make up only ~5% and ~13% of those samples).
But role mix isn’t a clean explanation. The engineer-vs-non-engineer gap varies sharply by industry, for example €20,000 in Media/Culture and only €1,000 in Tech itself. In Manufacturing and Professional Services engineers actually earn slightly less than non-engineers at the median. In sum, industry is a factor.
Do larger companies pay better?
Yes, and the salary climbs at every company-size step. The median climbs from €65,000 at companies with 1–10 employees to €85,000 at companies with 1,000+. That’s a 31% premium for working at the largest employers.
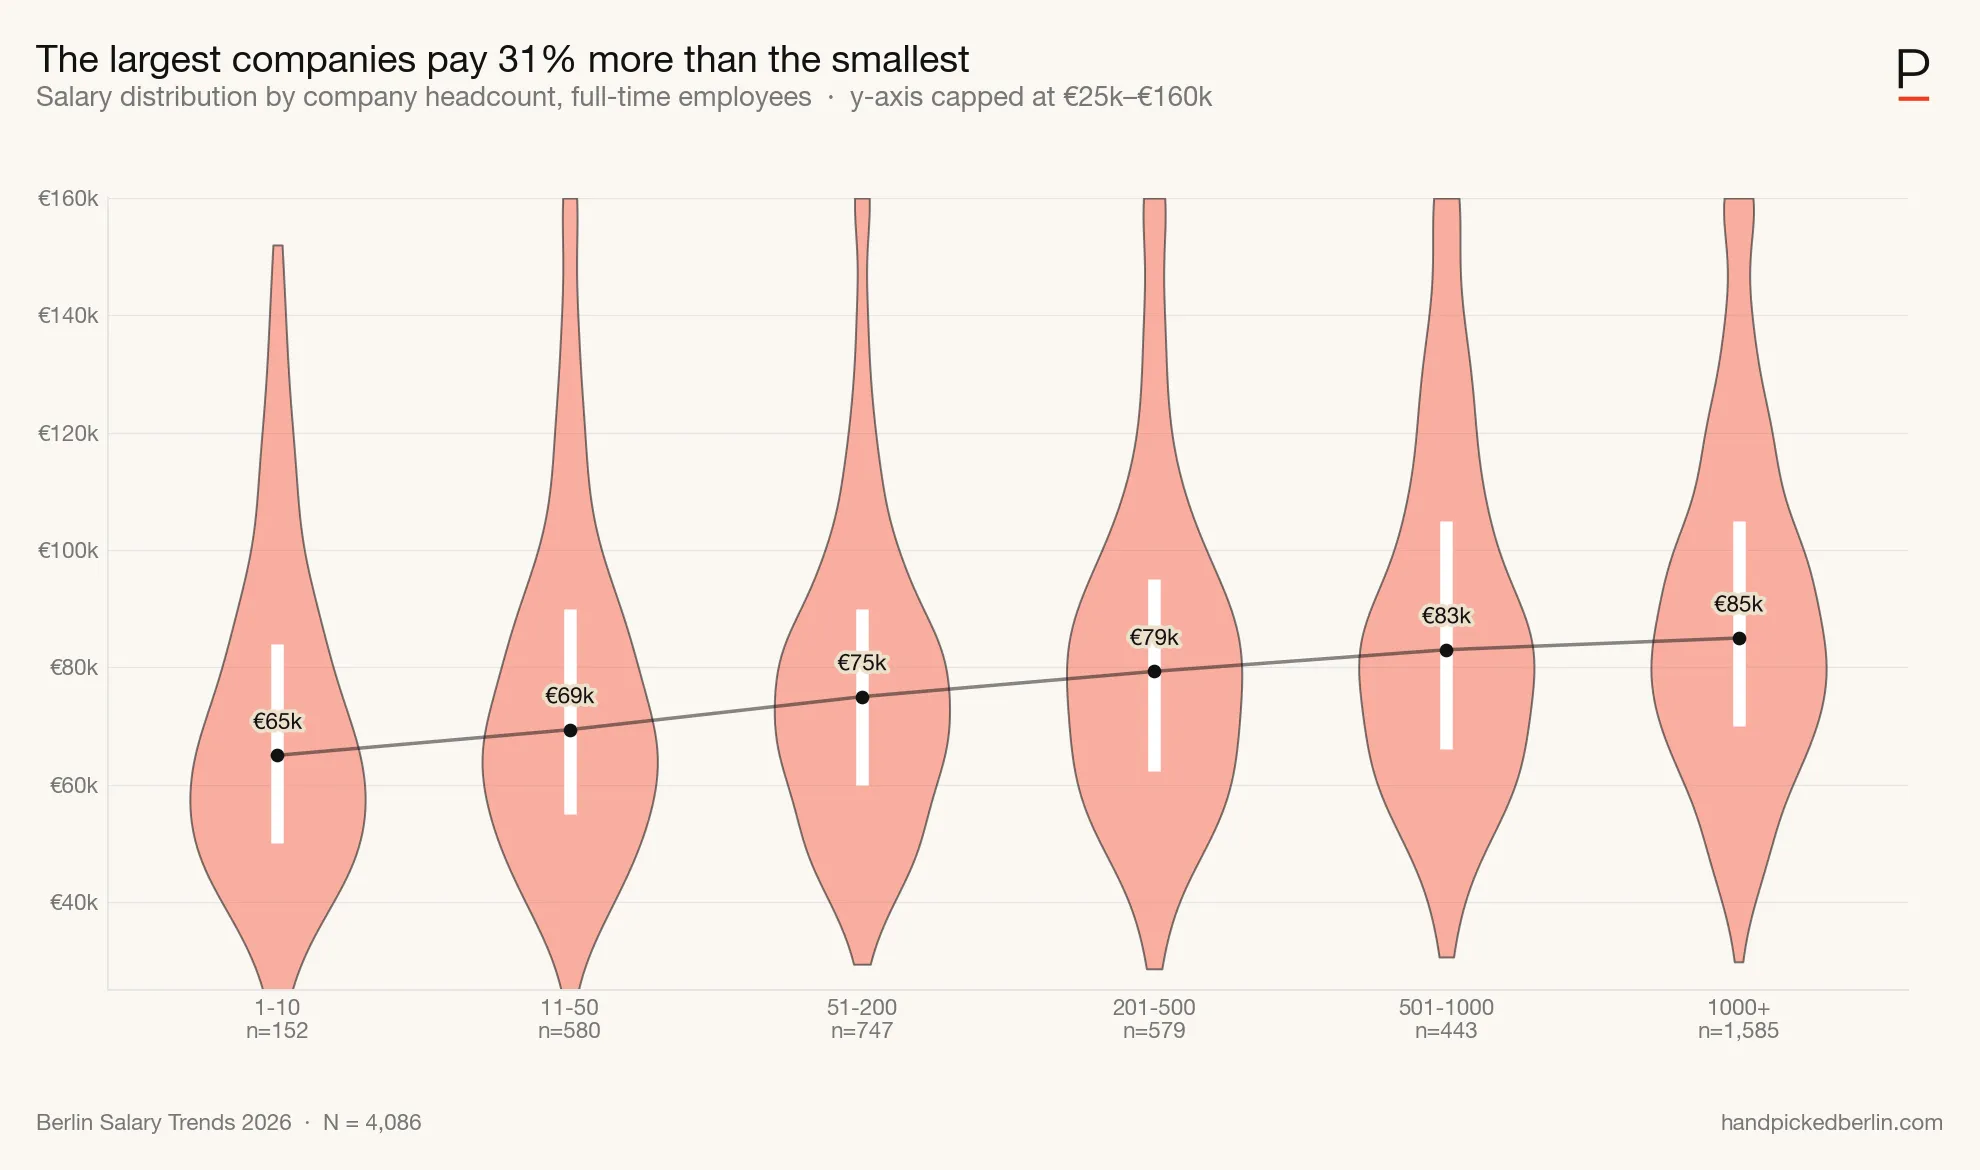
The biggest single step is between 11–50 (~€69,500) and 51–200 (€75,000) — a ~€5,500 jump, larger than any other neighboring-band gap. This is roughly the headcount range where Berlin startups raise Series A/B and shift from below-market early-stage pay to market rates.
Do startups pay more or less than established companies?
The surprise here is that there’s no surprise: in Berlin, startup base pay is effectively level with established-company base pay. At the median, startups pay just 1.3% more (€80,000 vs €79,000). People sometimes have an idea that startups pay less, but this doesn’t really show up in the median.
But base salary alone hides the real trade-off. 35% of respondents receive equity or VSOP (virtual stock options), almost all at startups. This only pays out if the company is acquired or goes public, which most never do. Employees in startups also work more: 56.2% of startup employees report overtime that isn’t compensated, versus 36.1% at established companies. The base pay is level, but the whole package isn’t.
In other words, at a startup you’re more likely to trade extra unpaid hours for a shot at a big payout down the road, with base pay coming out roughly the same.
How large is the gender pay gap?
The raw gap is 17.6%. Women in Berlin tech earn a median of €70,000 against €85,000 for men, a €15,000 annual difference. That’s a slight narrowing from 2025’s 20%+ gap, but the shape of the problem is unchanged.
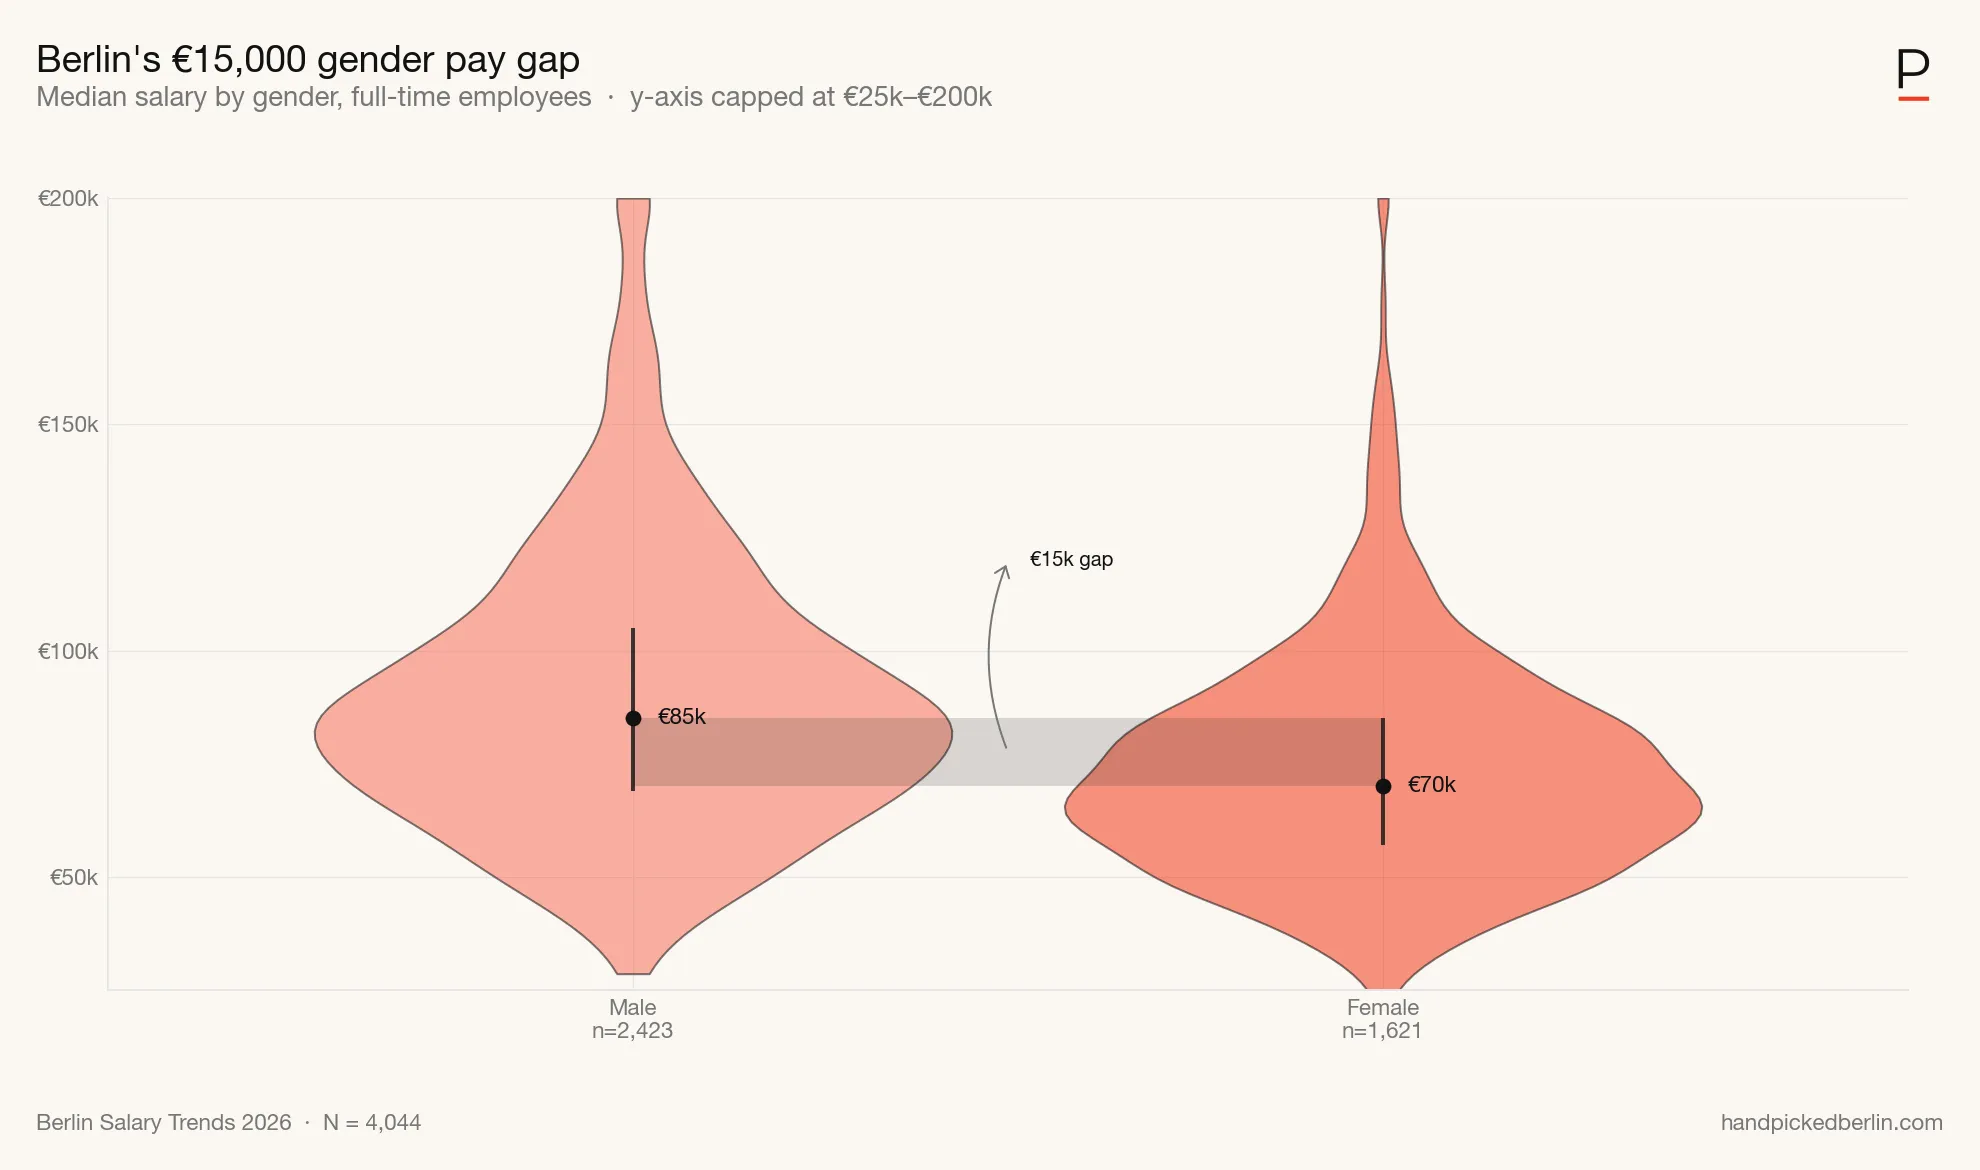
The chart shows the more honest picture: women and men cover the same salary range (plenty of women out-earn the male median, and plenty of men sit below the female median), but the bulk of women’s pay sits noticeably lower.
The gap widens with experience. Women enter roughly on par with men but fall further behind at every senior step.
| Experience | Men (median, n) | Women (median, n) | Gap |
|---|---|---|---|
| 3–5 years | €68,000 (n=430) | €60,000 (n=368) | 12% |
| 6–10 years | €85,000 (n=884) | €72,000 (n=640) | 15% |
| 11–15 years | €100,000 (n=608) | €85,000 (n=325) | 15% |
| 16–20 years | €105,000 (n=257) | €86,000 (n=124) | 18% |
| 21–30 years | €100,000 (n=101) | €85,000 (n=45) | 15% |
And the gaps persists in nearly every role. Women are earning less across the board, which probably means that the gap can’t be explained away as women clustering in lower-paying roles.
| Role family | Men | Women | Gap |
|---|---|---|---|
| Sales | €82,500 | €59,500 | 28% |
| Data Analytics | €83,725 | €68,000 | 19% |
| Product Design | €85,000 | €70,000 | 18% |
| SWE (general) | €90,000 | €75,500 | 16% |
| Strategy & BizDev | €86,500 | €75,000 | 13% |
| Marketing Leadership | €76,500 | €67,000 | 12% |
| PM Coordination | €72,000 | €63,200 | 12% |
| Engineering Leadership | €120,000 | €108,000 | 10% |
| Product Management | €90,000 | €84,000 | 7% |
| Finance | €84,500 | €80,000 | 5% |
(Role families shown where each side has n ≥ 20.)
The shape isn’t unique to Berlin. Ravio’s pan-European benchmark shows the same raw, unadjusted pattern across every major department and the gap exists at both the IC and manager track. Finance and Commercial sit at the top end (raw gaps around 20% for managers), Engineering and Marketing closer to the middle, but no department in European tech reports a raw gap below 8%.
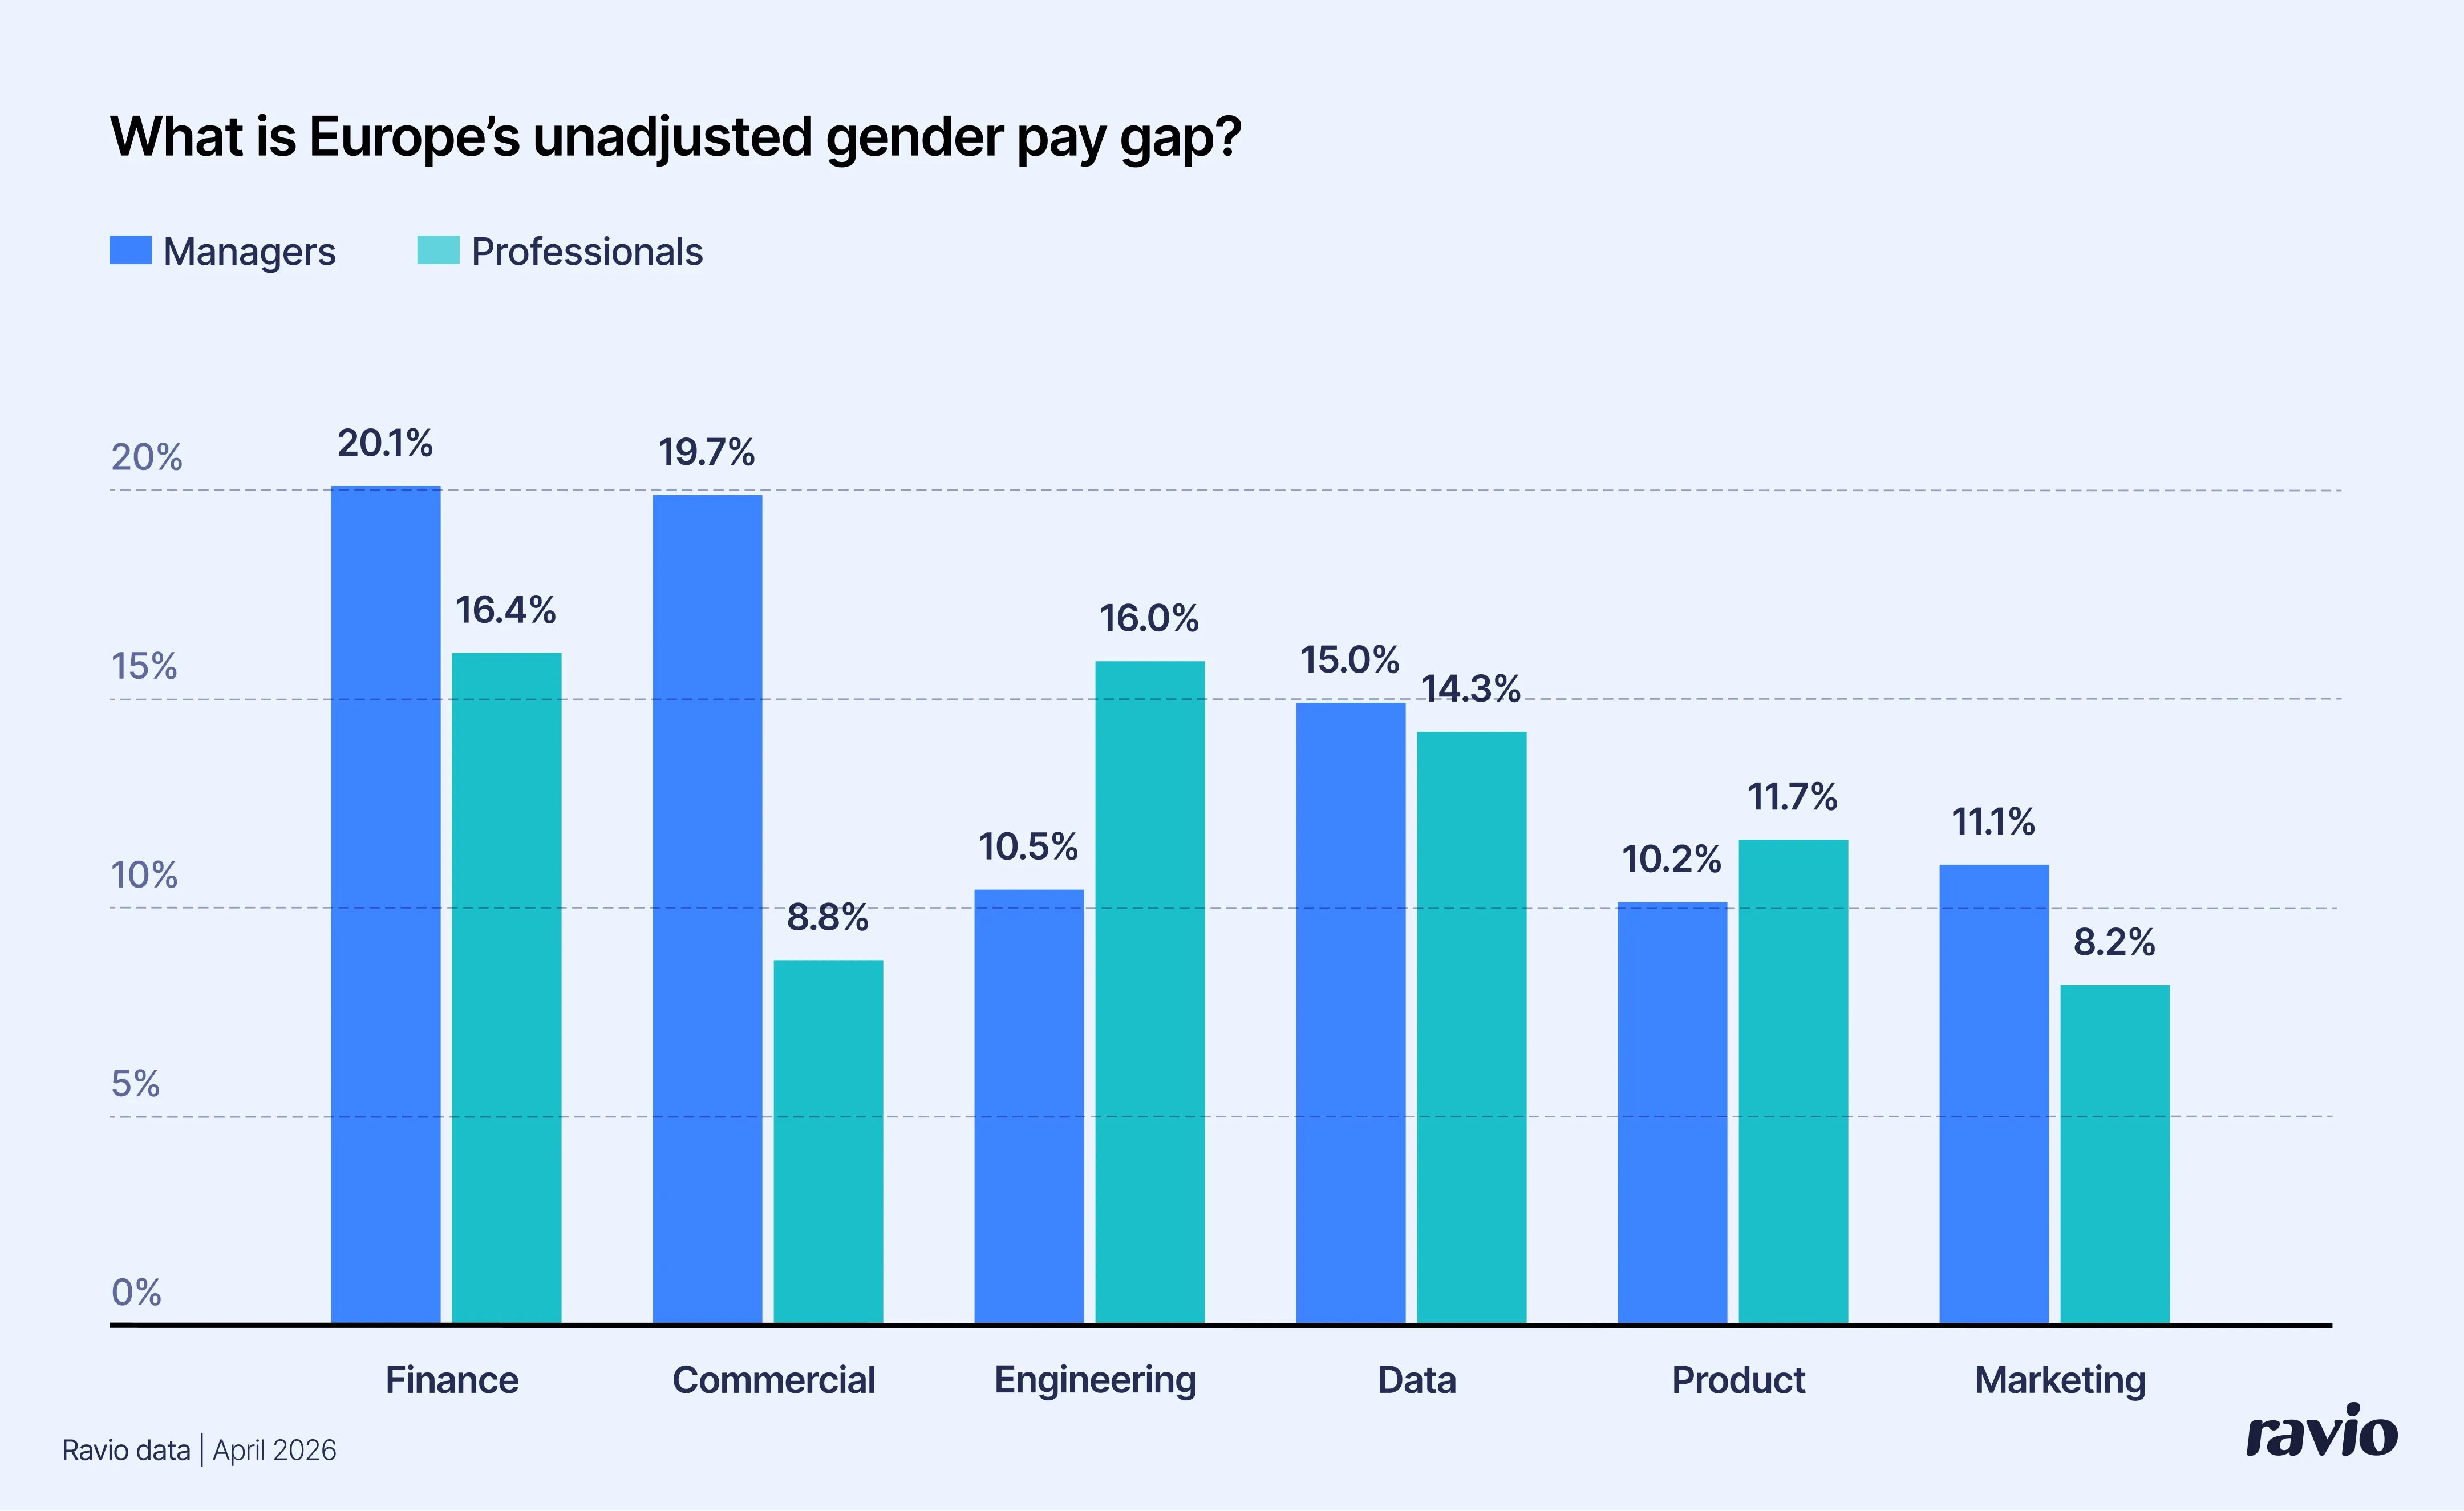
Ravio benchmark data, Europe-wide. Berlin not separately broken out, the chart provides European context for the raw gap discussed above.
Each of these cuts controls for one factor at a time. The next section asks what’s left when you strip them out simultaneously, and whether the “women don’t negotiate” story holds up.
Does the gap hold up when you strip out the easy explanations?
The raw gap is what it is. The harder question is what’s left once you rule out the usual explanations — that women cluster in lower-paying roles, have less experience, or don’t negotiate. The tables in the previous section already push back on the first two. Here we address negotiation head-on, then ask what survives an OLS regression.
Negotiation rates are similar by gender. 49% of women negotiated their current salary or most recent raise, against 46% of men. The common “women negotiate less” hypothesis doesn’t show up in this dataset.
Role, experience, and negotiation all fail to explain the gap on their own. The harder question is what’s left when you hold them all constant at the same time.
The 2026 controlled gap is 6.6%. Holding experience, role family, seniority, and company size constant, women in the sample earn about 6.6% less than men. This is the gap that survives the most common explanations — but it’s not a clean estimate of discrimination. Finer controls we don’t have (specific job title, employer, hours, performance ratings, prior salary) would likely absorb some of it. In other words, 6.6% is closer to a ceiling than a floor: better controls would shrink it, not raise it. (Method, supported by Claude Code over several iterations: OLS on log-salary; n=3,955; female coefficient −0.068, robust SE 0.009, p<0.001.)
For a direct comparison to 2025, we re-ran last year’s simpler method — median gap within each role × experience group — on 2026 data and got 7.6% (95% bootstrap range: ~5–13%), against 14.9% in 2025. The narrowing is real but smaller than the headline suggests: the 2025 figure used roughly a third of the 2026 sample size, and the weighted-bin method overstates the gap when cell sizes are small. A meaningful share of the apparent drop is better measurement, not a labor-market shift.
The 6.6% isn’t a way to wave off the 17.6%. The variables we control for — role mix, seniority — are partly outcomes of discrimination themselves: women end up in lower-paying role families and at lower seniority levels for reasons that aren’t neutral. Controlling them away makes the math cleaner but also hides part of the gap. Both numbers measure something real.
Want to see the gender pay gap for your specific role — or understand the method behind the 6.6% figure?
Does German fluency lead to higher pay?
No, and the relationship is slightly inverted. B1 speakers (€84,000) and A1 beginners (€82,500) sit at the top of the German-proficiency salary table, while C2 / native speakers (€75,000) and C1 (€74,000) sit at the bottom.
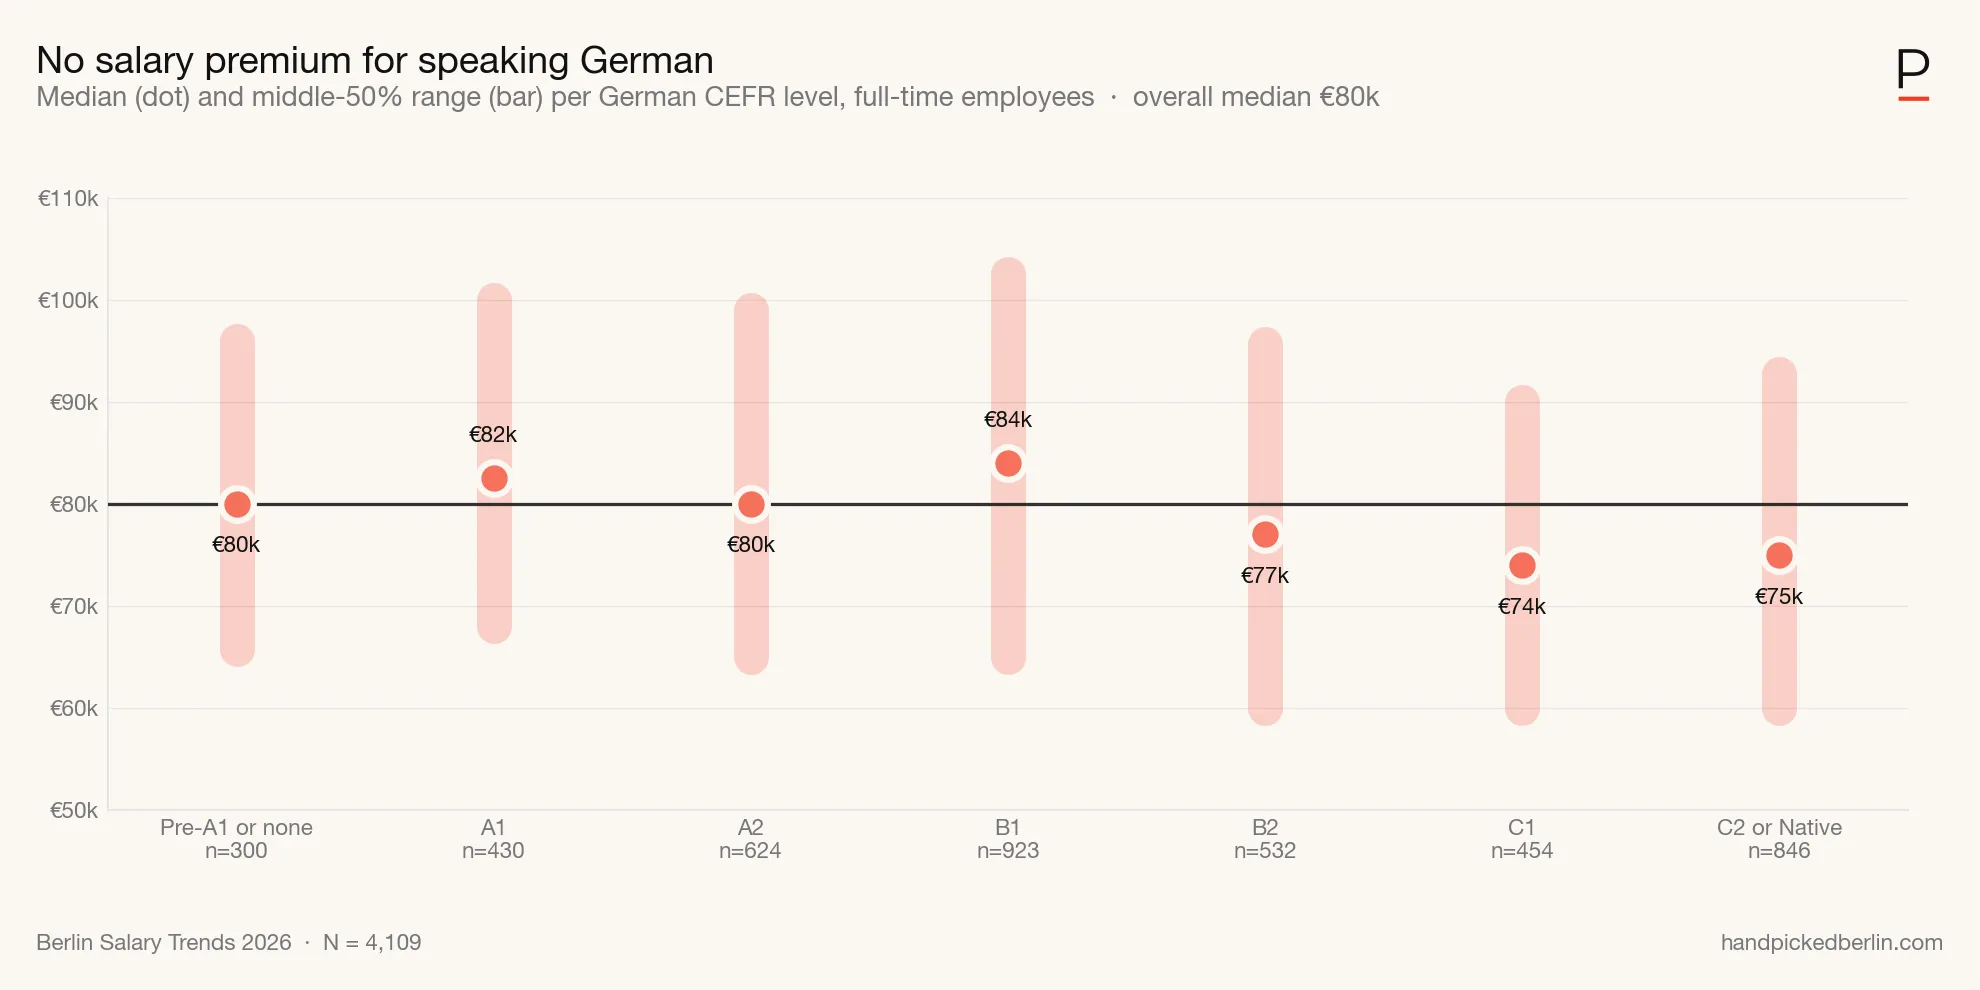
To make it clear: speaking German won’t hurt your salary. The highest-paid roles in Berlin tech (engineering, AI, product) are dominated by international hires who learn (or not) just enough German to live comfortably, while German native speakers are spread across a wider mix of industries including lower-paying sectors like media, education, and the public sector.
If you’re thinking about whether to invest in German classes for the salary boost: the answer, for tech roles, remains the same as last year: invest in German for the life you want in Berlin, not for the paycheck.
Another real benefit of fluent German speakers is a bigger pool of offers to choose from: fluent German lets you escape the English-speaking tech bubble, which means more optionality and more leverage to be picky in the German-speaking side of the job market (for example in consulting, traditional industry, Mittelstand or even public sector).
Does citizenship affect compensation?
The headline is the same surprise as 2025: non-EU passport holders earn slightly more at the median (€80,000) than German citizens (€78,000) and other-EU citizens (€75,000). Dual citizens with a German/EU + non-EU passport top the list at €85,000 (n=457); the chart’s combined “Dual” group reads €84,000 because it folds in the smaller German/EU + EU dual-citizen subgroup (n=80, median €79,500).
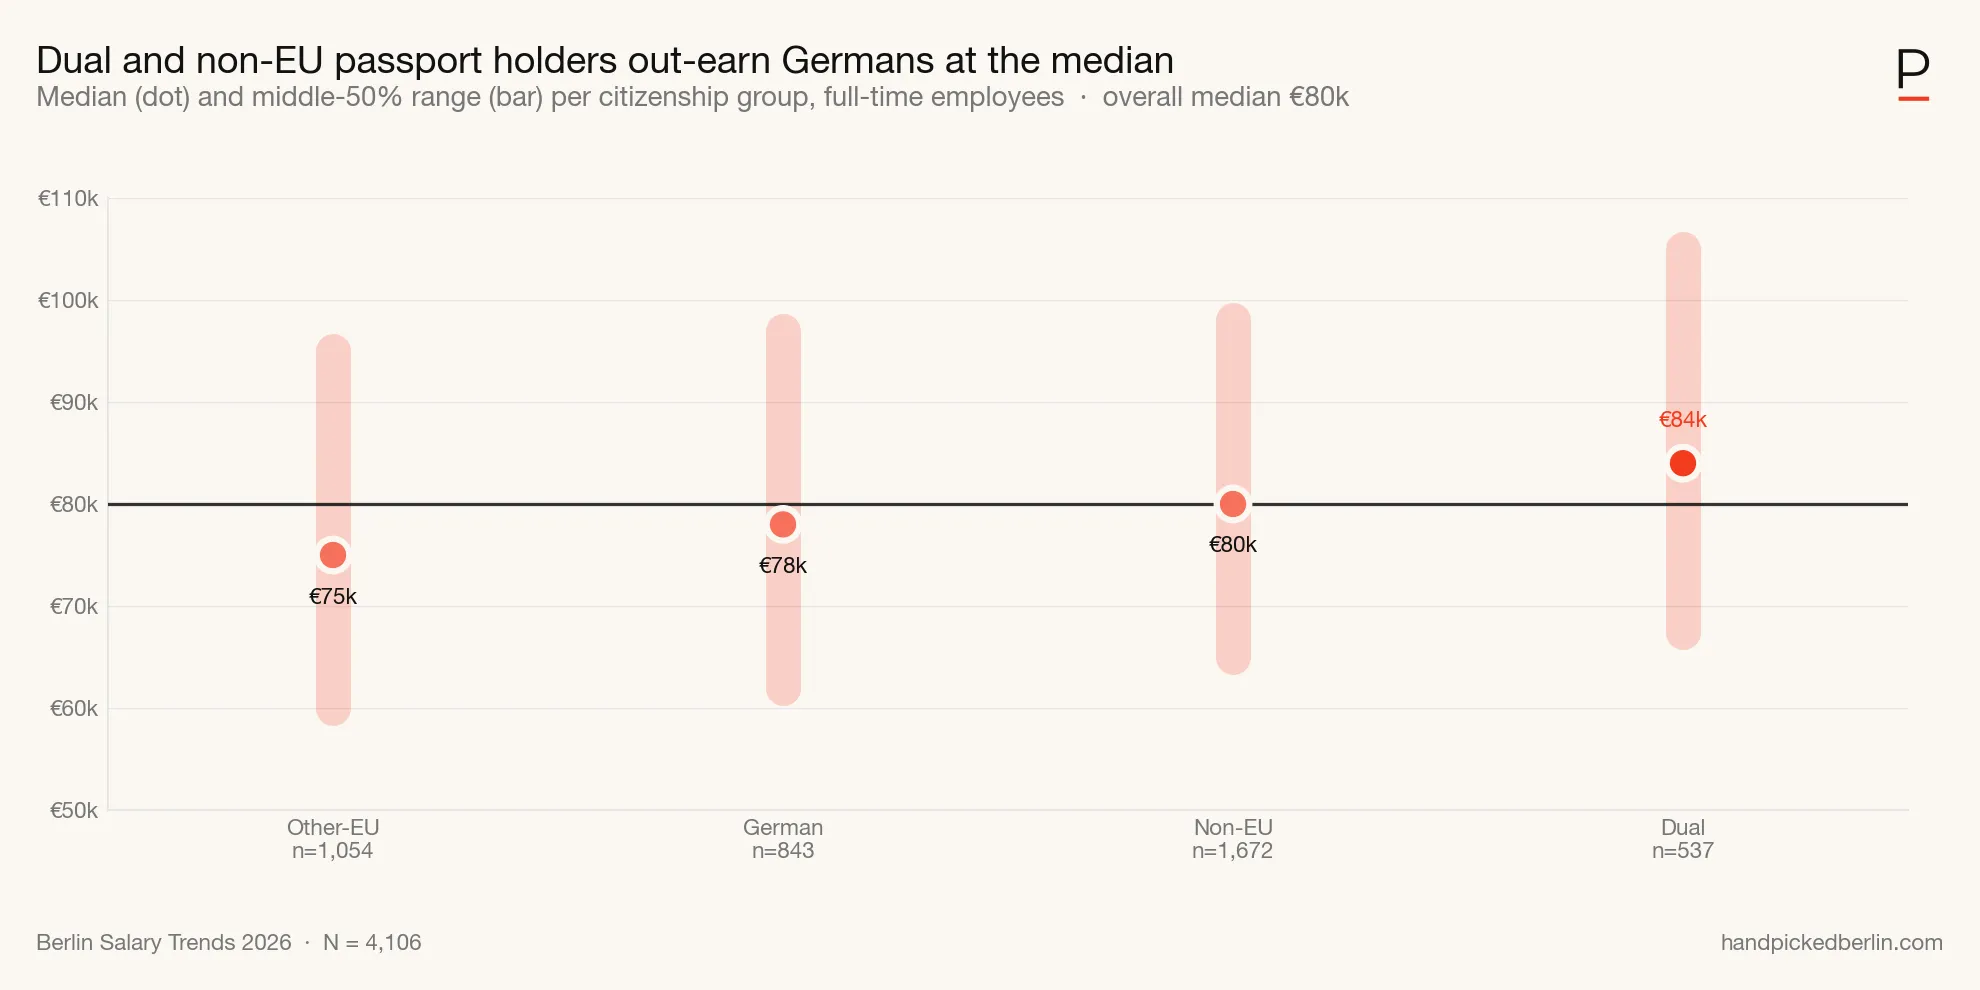
The most realistic explanation is selection bias and not a citizenship premium. Relocating to Berlin from outside the EU requires a visa-sponsored role, which tends to mean an in-demand skill set (engineering, data, AI) at a company large enough to sponsor. This is a recipe for a higher-than-average salary.
The distributions overlap heavily. The medians differ because of who makes it to Berlin in the first place, not because non-EU workers out-earn Germans in the same role.
How does education level affect salary?
Less than you’d think. Bachelor’s (€80,000) and Master’s (€79,200) are essentially identical at the median, with PhDs commanding a real but modest €5,000–6,000 premium (€85,000). In Berlin tech, the degree on your wall matters far less than the role, the company, and the years of experience.
How many days are people in the office?
Hybrid is the established norm. 22% of respondents are fully remote, another 50% are in 1–3 days a week, and only 18% spend 4+ days in the office.
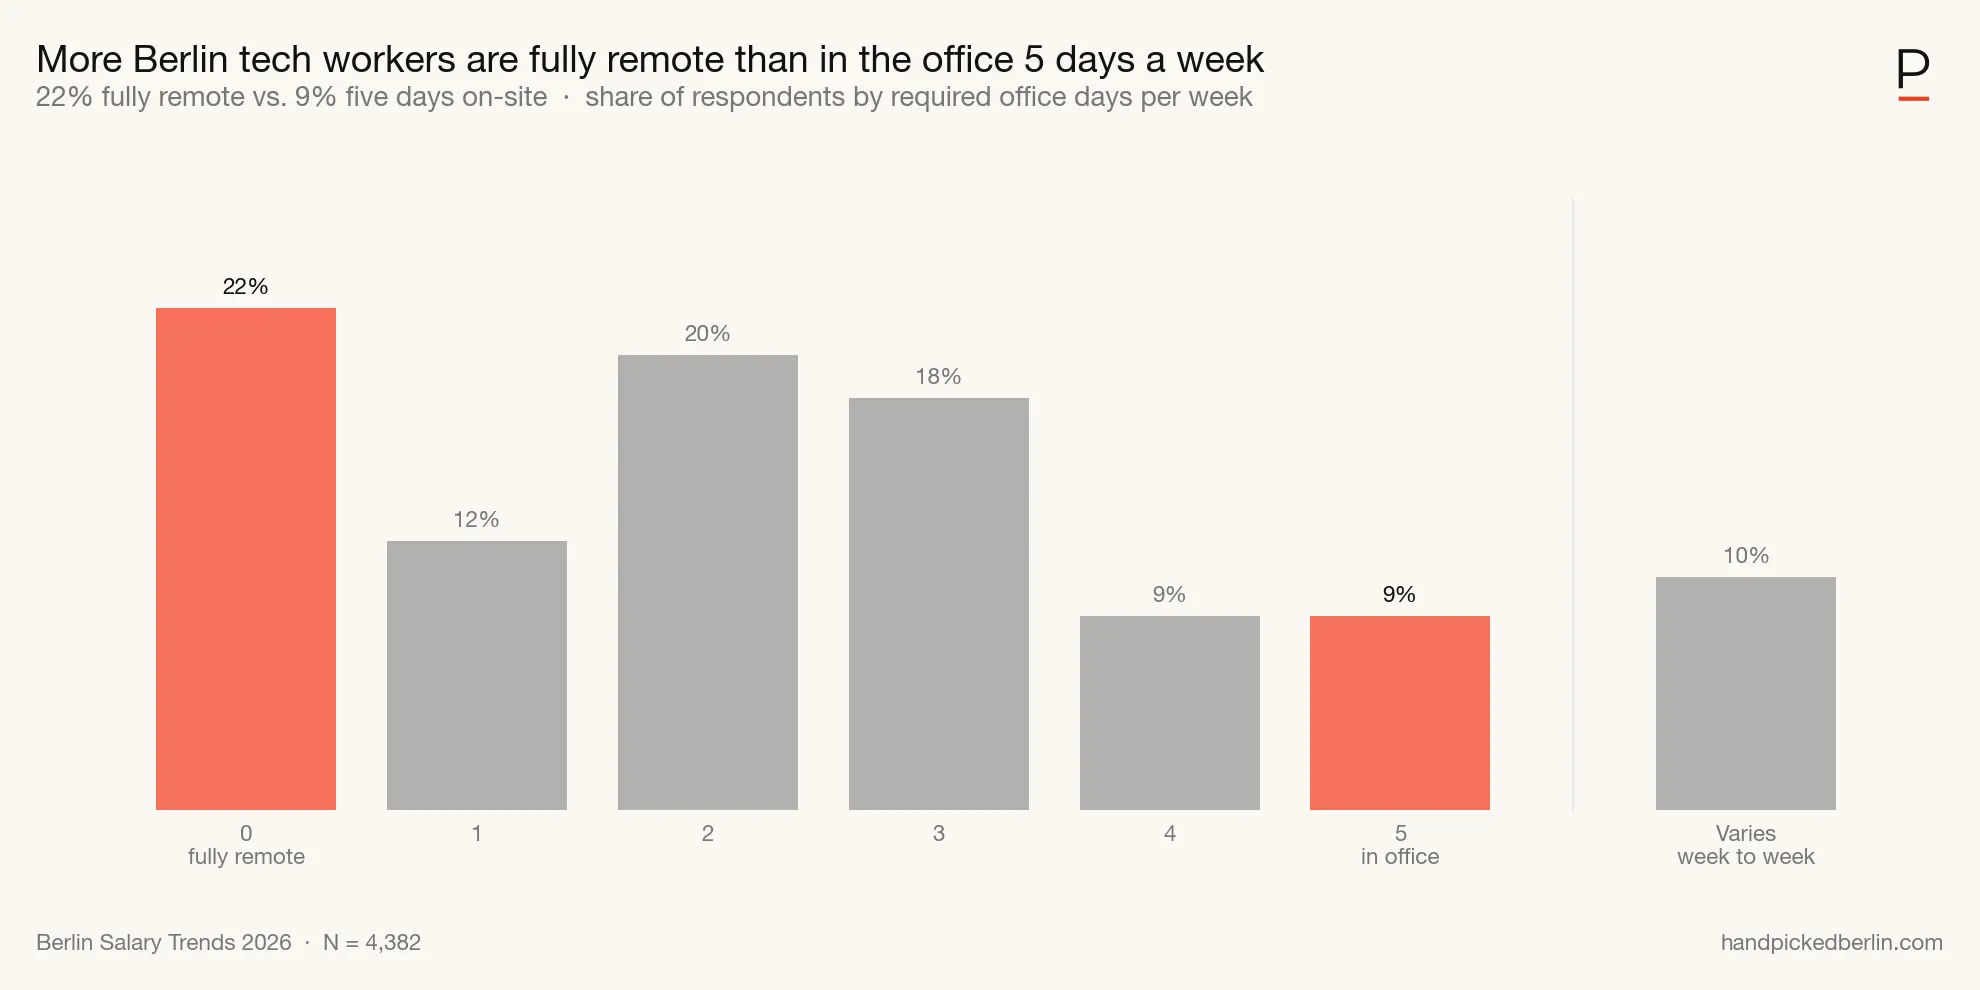
“Varies week to week” picks up another 10%. Berlin tech is, in practice, a 1–3-day-a-week office market. More workers are fully remote than in the office five days a week (22% vs 9%).
What would happen if companies mandated 4+ office days?
This is one of the most interesting findings this year.
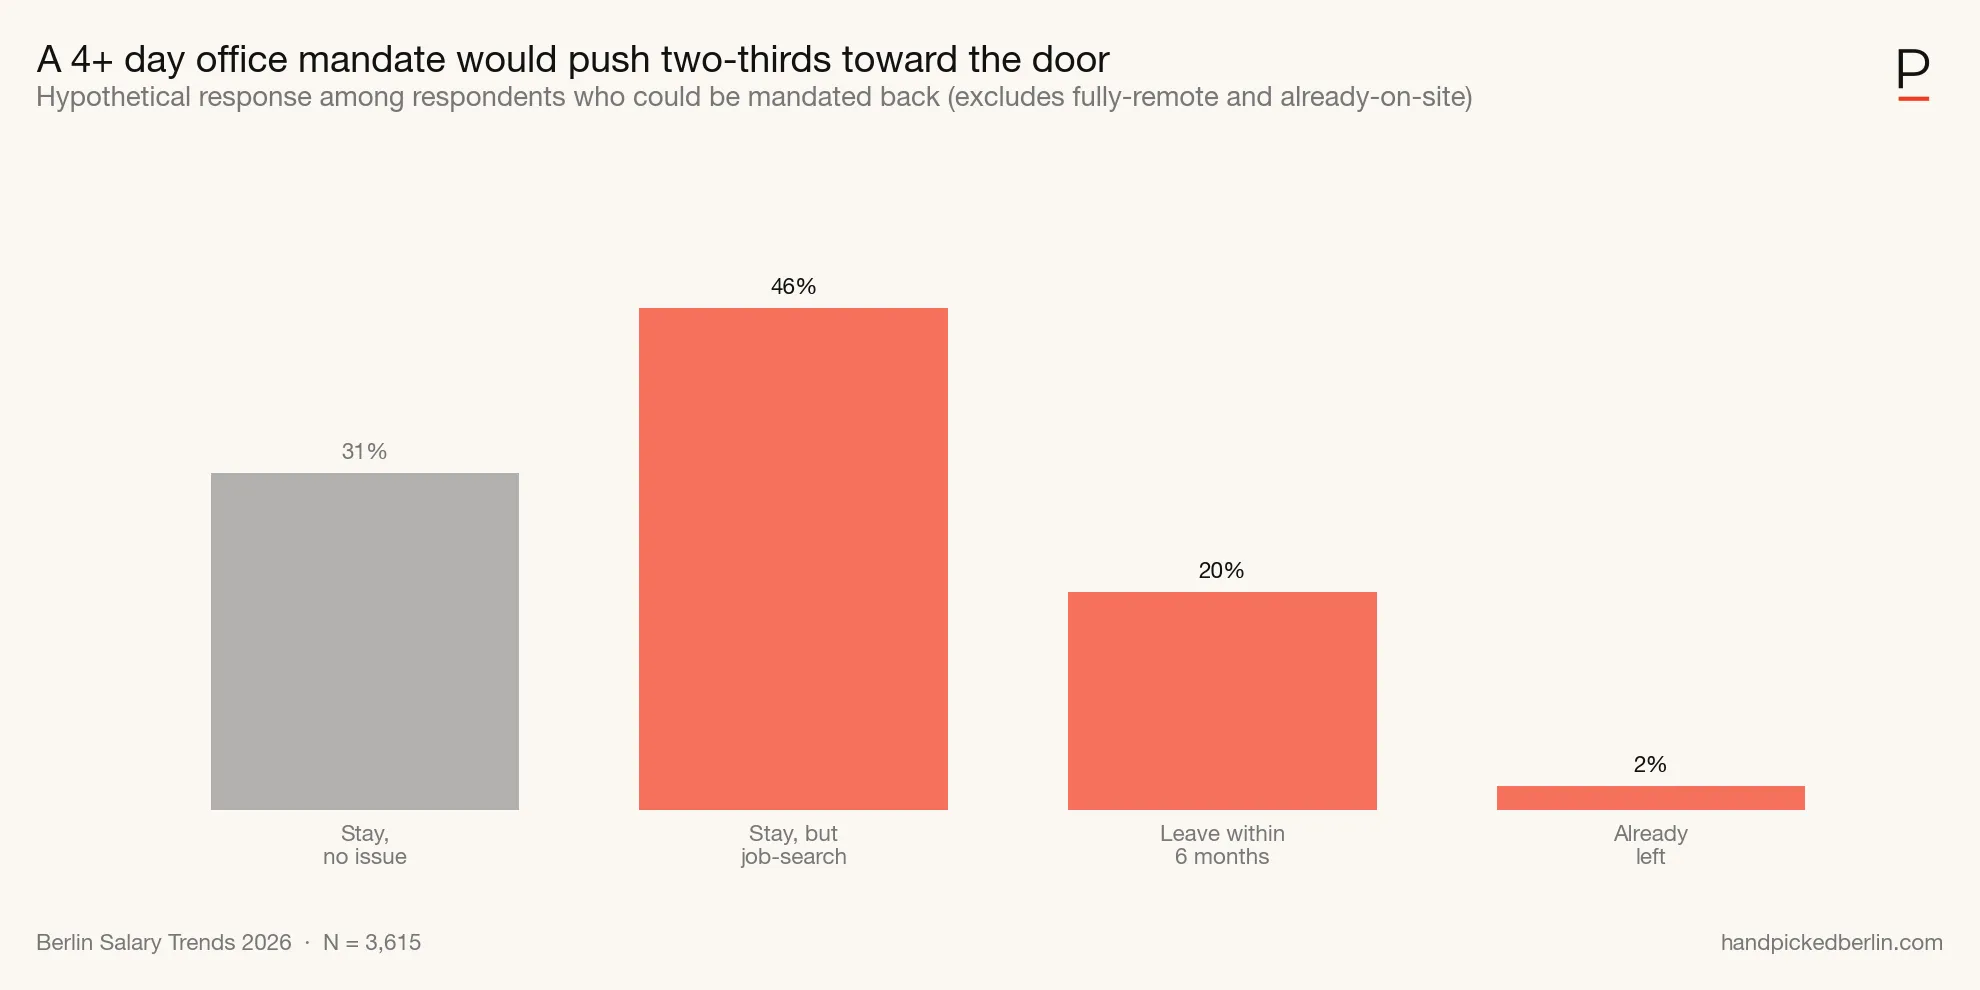
Among respondents who could actually be affected by an RTO mandate (i.e. not already fully on-site or fully remote): 20.2% would leave within six months, 46.4% would stay but immediately start job-hunting, and another 2.2% have already left a previous role over RTO. The remaining 31.2% would stay without issue.
For employers, the math is harsh. A 4+ day mandate would push roughly two-thirds of in-office-eligible employees to leave or start looking. The current hiring market favors employers — backfilling is easier than a year ago — but the people who walk first are the ones with options: senior, in-demand, marketable.
See the RTO retention risk breakdown by role, seniority, and company size.
What makes people consider leaving?
Compensation dominates. 45.2% name “significantly higher compensation (20%+)” as their top driver, more than triple the next answer.
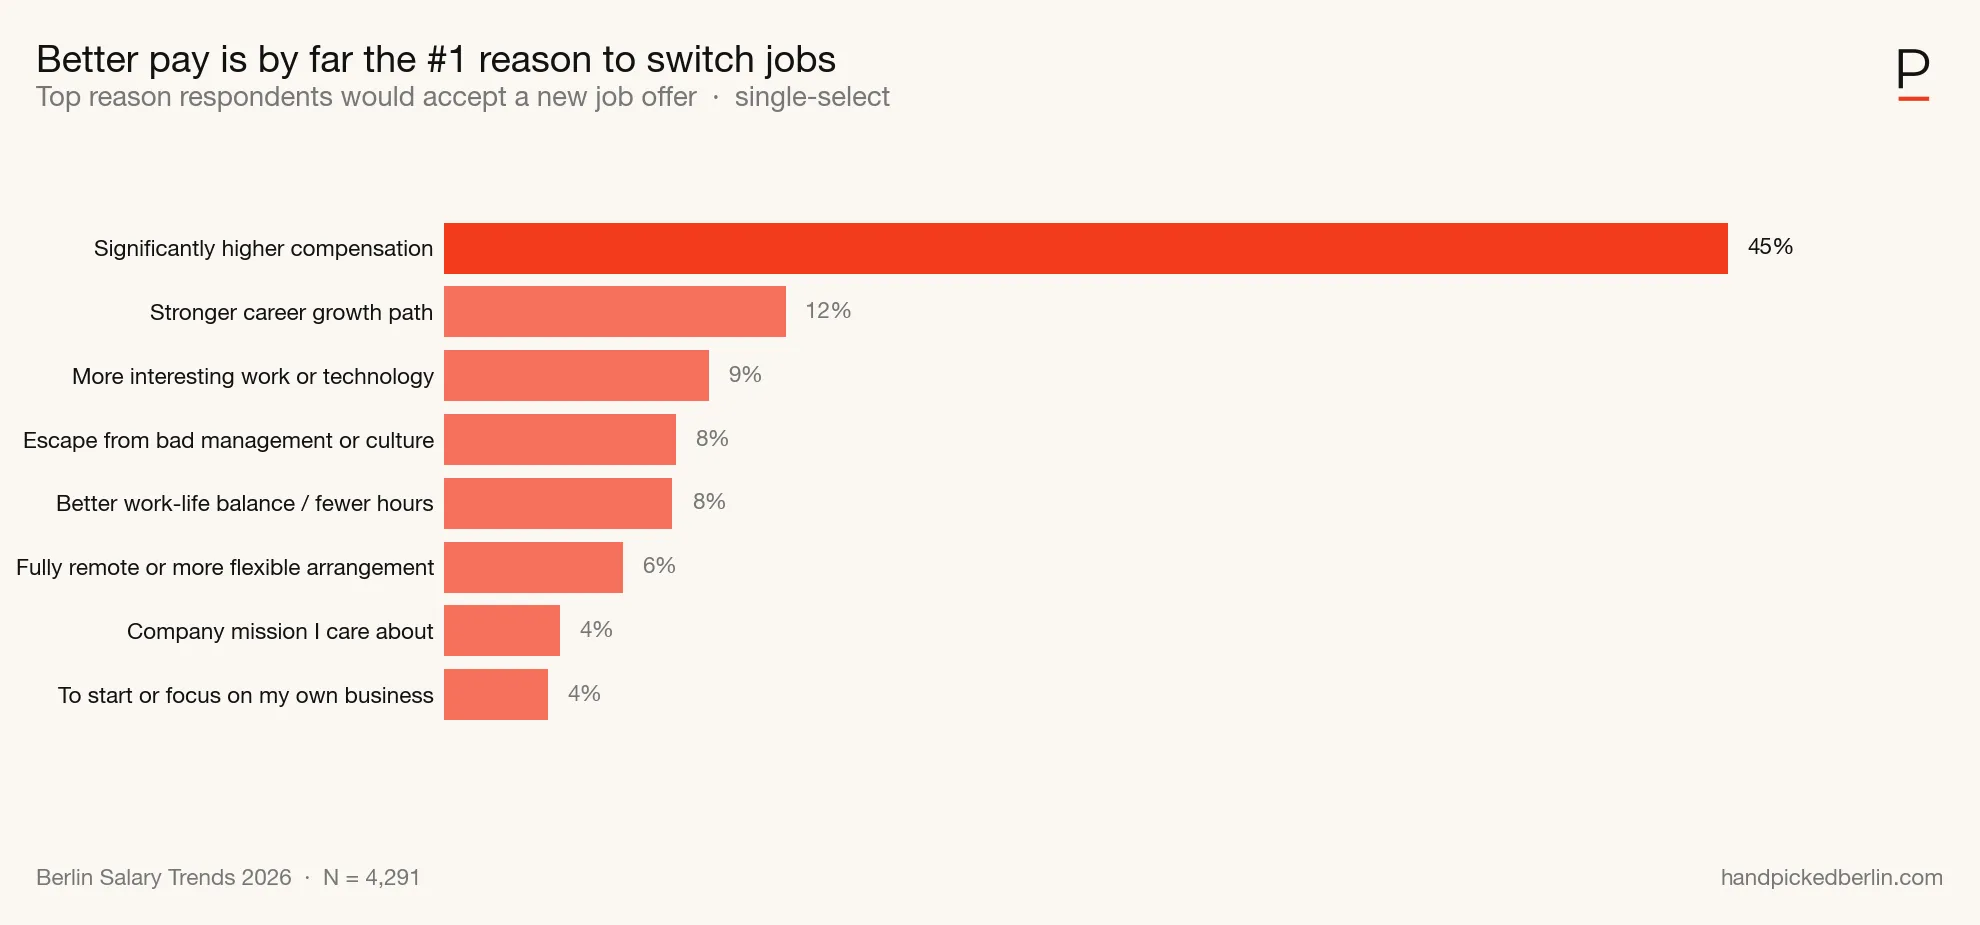
Career growth (12.0%), interesting work (9.3%), escaping bad management (8.2%) and work-life balance (8.0%) are behind it.
So, employers: perks and culture decks can’t beat a 20%+ pay bump for nearly half the market. The only way to keep people is to pay them well in the first place.
How many plan to change jobs in 2026?
33.0% are likely or very likely to change jobs in 2026, a mild uptick of ~2pp vs 2025’s 30.82%. Not flat, but not a dramatic surge either. Despite a tougher hiring market through 2025, intent to move has ticked up. Combined with the RTO and satisfaction data, that’s a workforce that is actively shopping.
33% are shopping — and if project-based work is on your list, Factofly employs you for each project, with contracts, payroll, taxes, and contributions handled. That’s a compliant setup for everyone and a net salary for you. Get access now →
How satisfied are workers with their salary?
On a 1–5 satisfaction scale, respondents are split — 34% are dissatisfied (score 1 or 2), 37% are satisfied (score 4 or 5), with few raving about it (just 12% give a 5). It’s not surprising, then, that 33.0% plan to change jobs and 45.2% name compensation as their top driver for moving.
Men: 3.08. Women: 2.92. The 0.16-point gap narrowed slightly from 2025 (0.19) but remains a persistent feature of the Berlin tech market.
Do companies have an AI policy?
AI is widespread and that’s not surprising, especially looking at the perceived productivity gains in the next section. Nearly four out of five Berlin tech employers actively encourage or mandate AI use (68.8% + 10.3%); only 8.9% have no policy or simply ban it.
| Policy | n | % |
|---|---|---|
| Encouraged and provided by company | 2,967 | 68.8% |
| Required / mandated by company | 445 | 10.3% |
| Allowed but not officially supported | 445 | 10.3% |
| No clear policy | 326 | 7.6% |
| I don’t know | 72 | 1.7% |
| Discouraged or banned | 57 | 1.3% |
Excludes “prefer not to say” (n=45). Base: 4,312.
Has AI made workers more productive?
Workers say yes, decisively. 84.7% report a productivity increase (36.5% significant, 48.2% slight), 10.1% report no change, and only 2.0% say AI decreased their productivity (the remaining 3.2% don’t use AI).
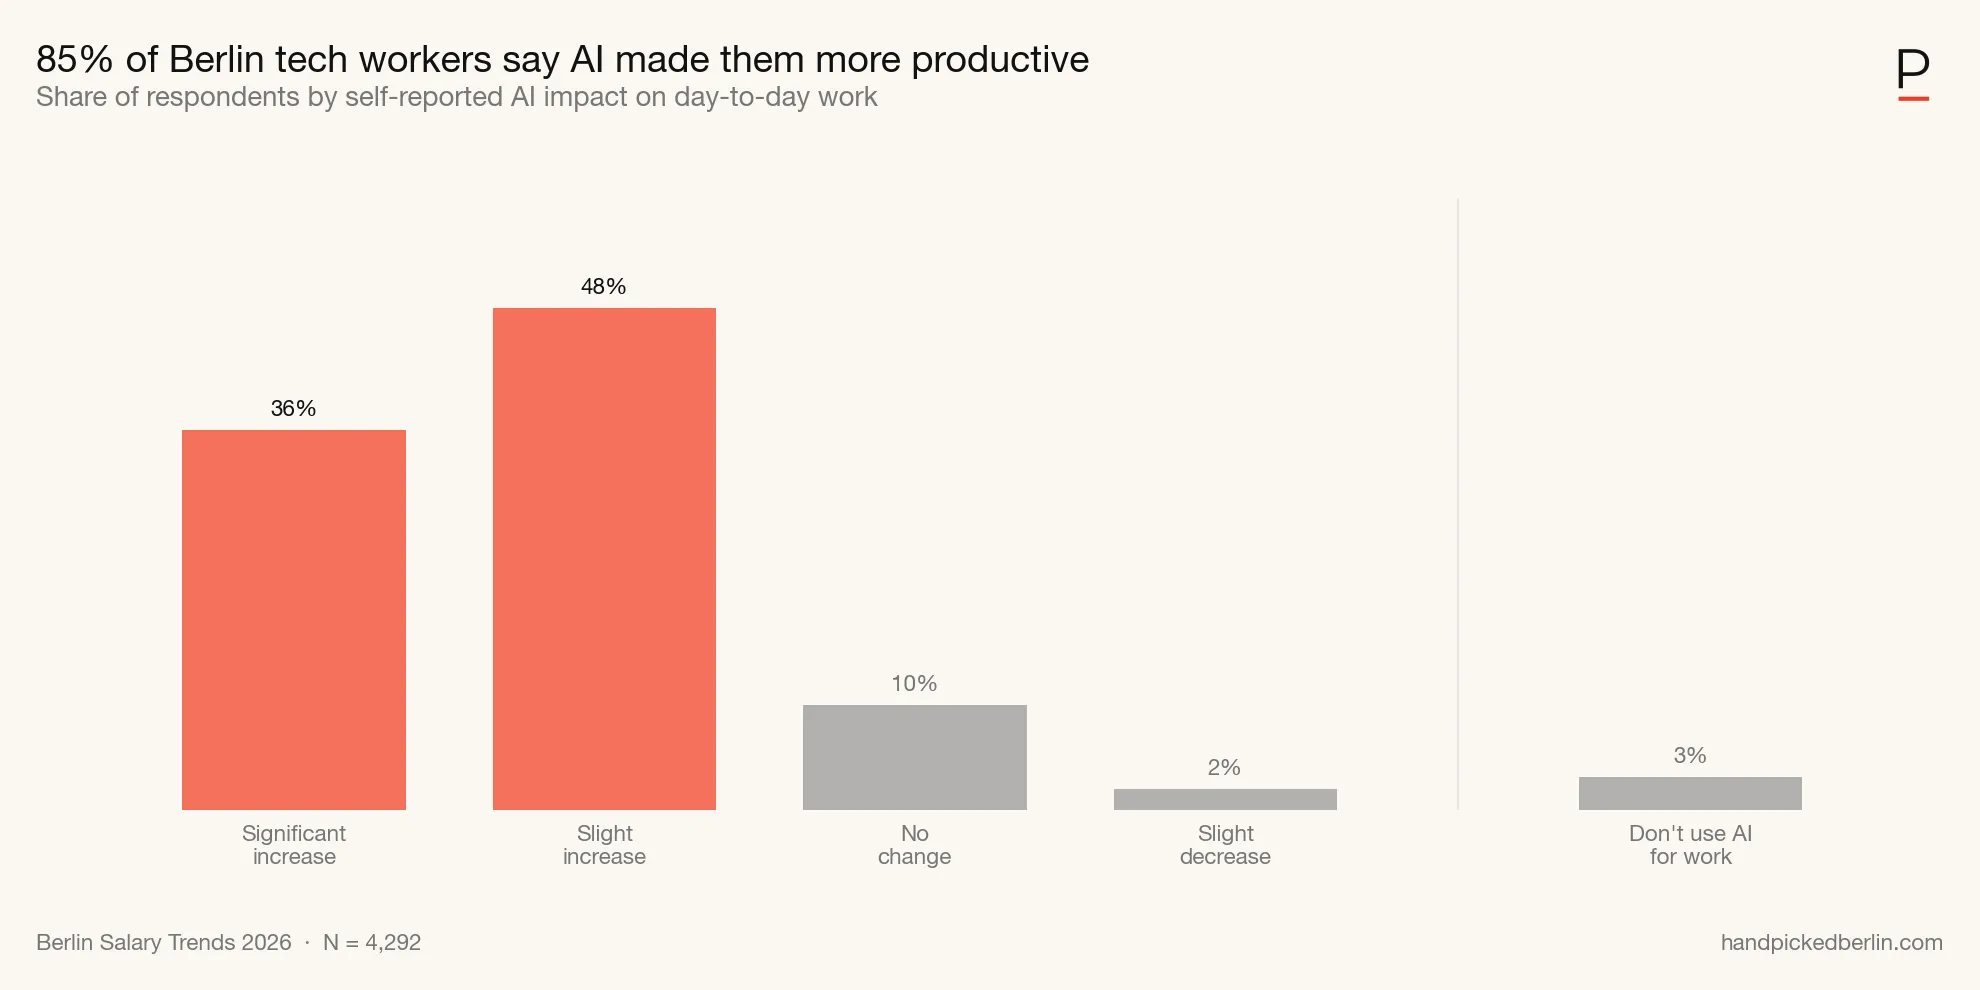
This is a self-reported and subjective statement (and productivity is extremely hard to measure), but the direction is clear and consistent, and the share reporting significant gains is too large to dismiss as enthusiast bias.
Are workers worried about AI replacing their jobs?
The same people reporting a productivity boost are also nervous about being replaced. 53.3% say they’re somewhat concerned their role will change significantly, 7.9% think AI could replace their role outright, and only 22% are unconcerned.
Another 17% are openly positive about AI’s career impact. It’s basically anxious adoption: workers using AI daily, getting more done with it, and quietly worried about what that productivity gain means for headcount in the coming years.
How many workers use AI tools personally?
87.5% of Berlin tech workers use AI tools personally, which is running slightly ahead of company policy (79.1% of companies actively encourage or mandate AI use). Workers are a bit more enthusiastic about AI than their employers’ policies require. The bigger story in the gap is that there are very few holdouts: only 12.5% of respondents report not using AI tools personally.
Who works in Berlin’s tech industry?
Berlin tech is international, mid-career, and still majority male. The split is 58% men / 40% women / 0.9% non-binary (n=41 non-binary). Unfortunately, the share of women in the sample dropped this year (from 44.4% in 2025).
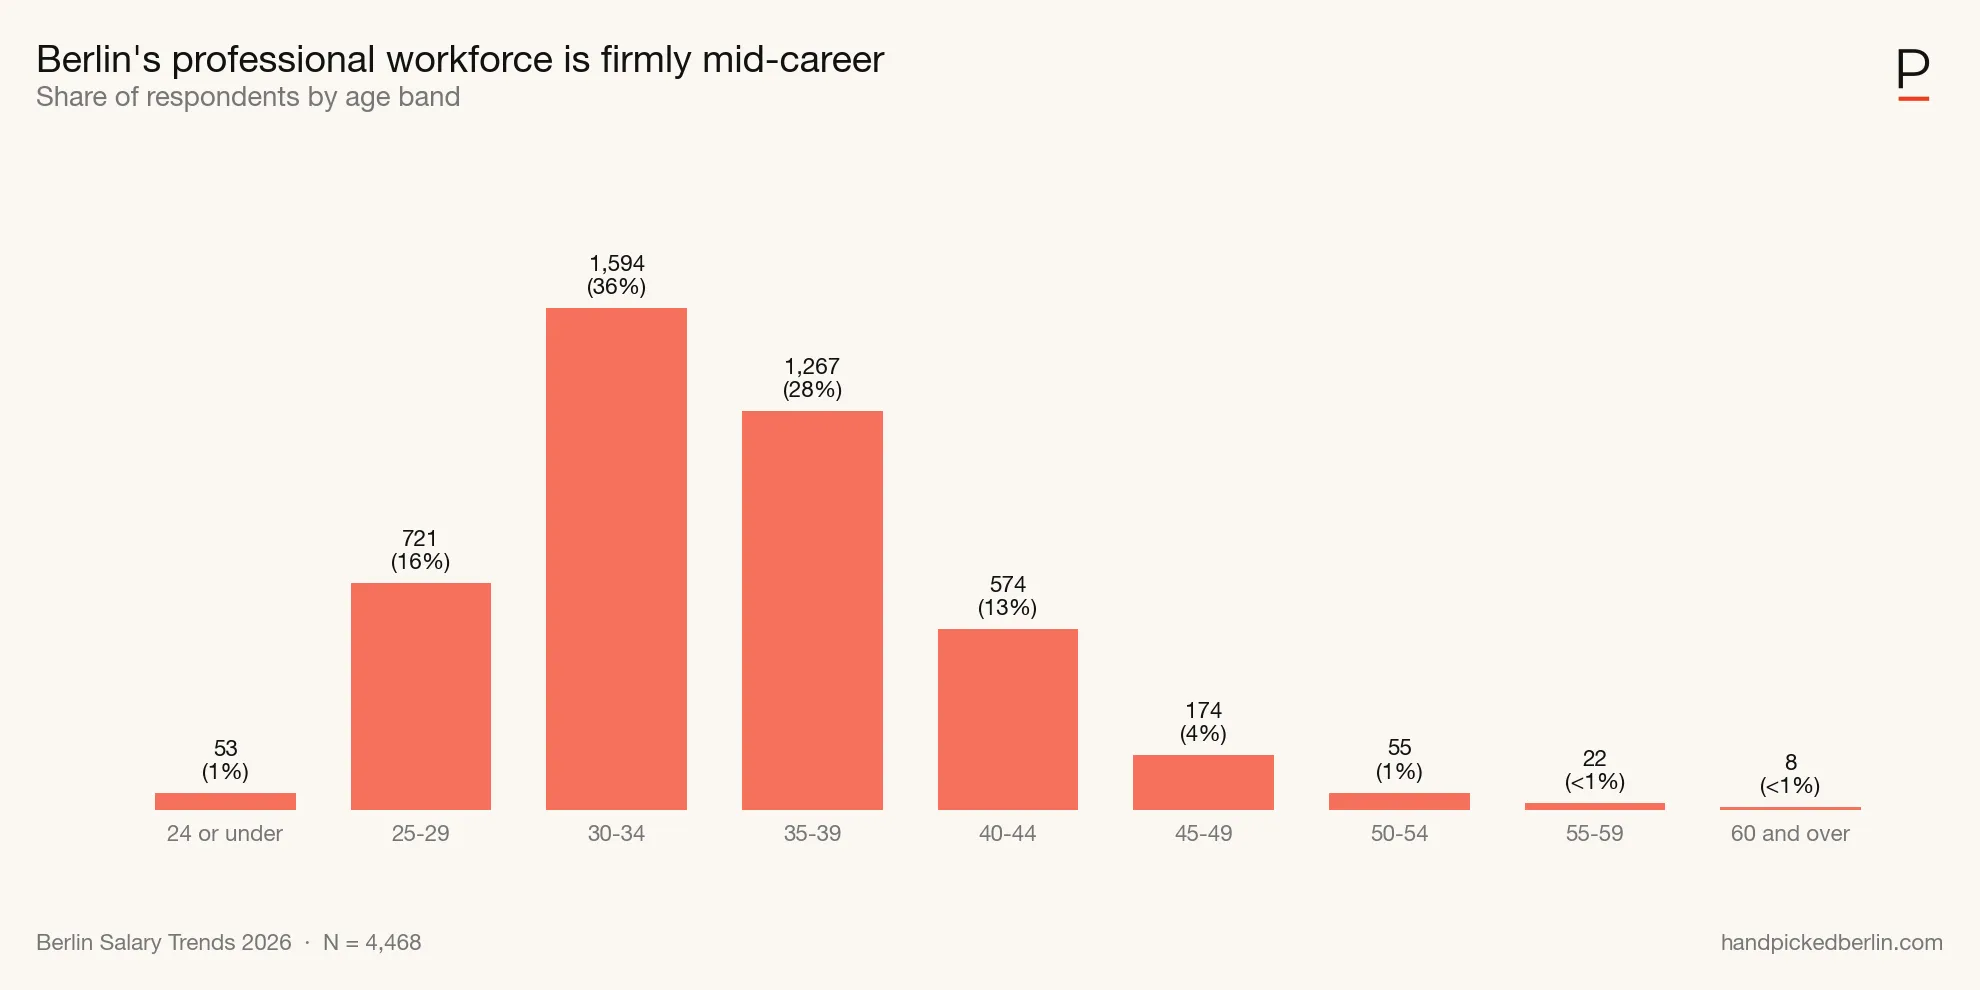
The dataset is firmly mid-career: 36% are 30–34 and 28% are 35–39. Workers under 25 (1.2%) and over 50 (1.9%) remain niche slices.
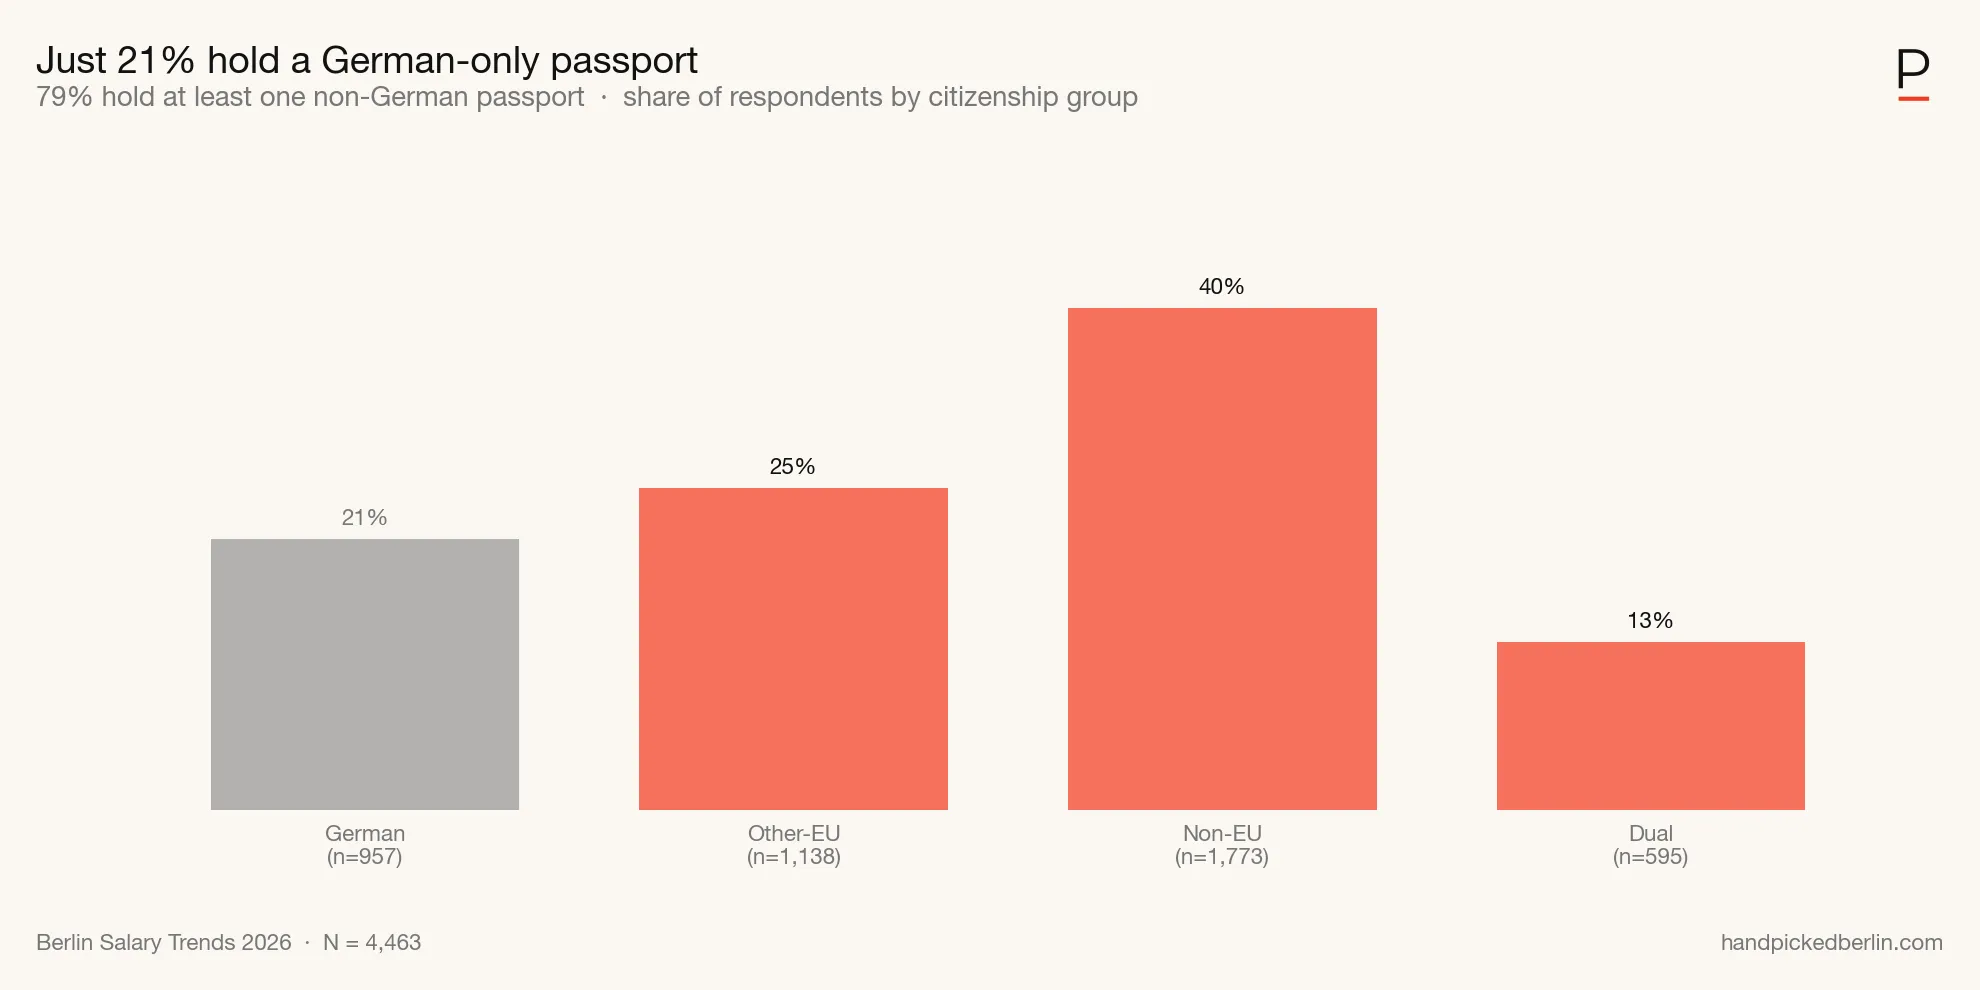
Berlin tech is international. 79% of respondents hold a passport other than (only) German, with non-EU citizens the single largest group at 40%. German citizens make up 21%. This is also because of the data collection channel bias.
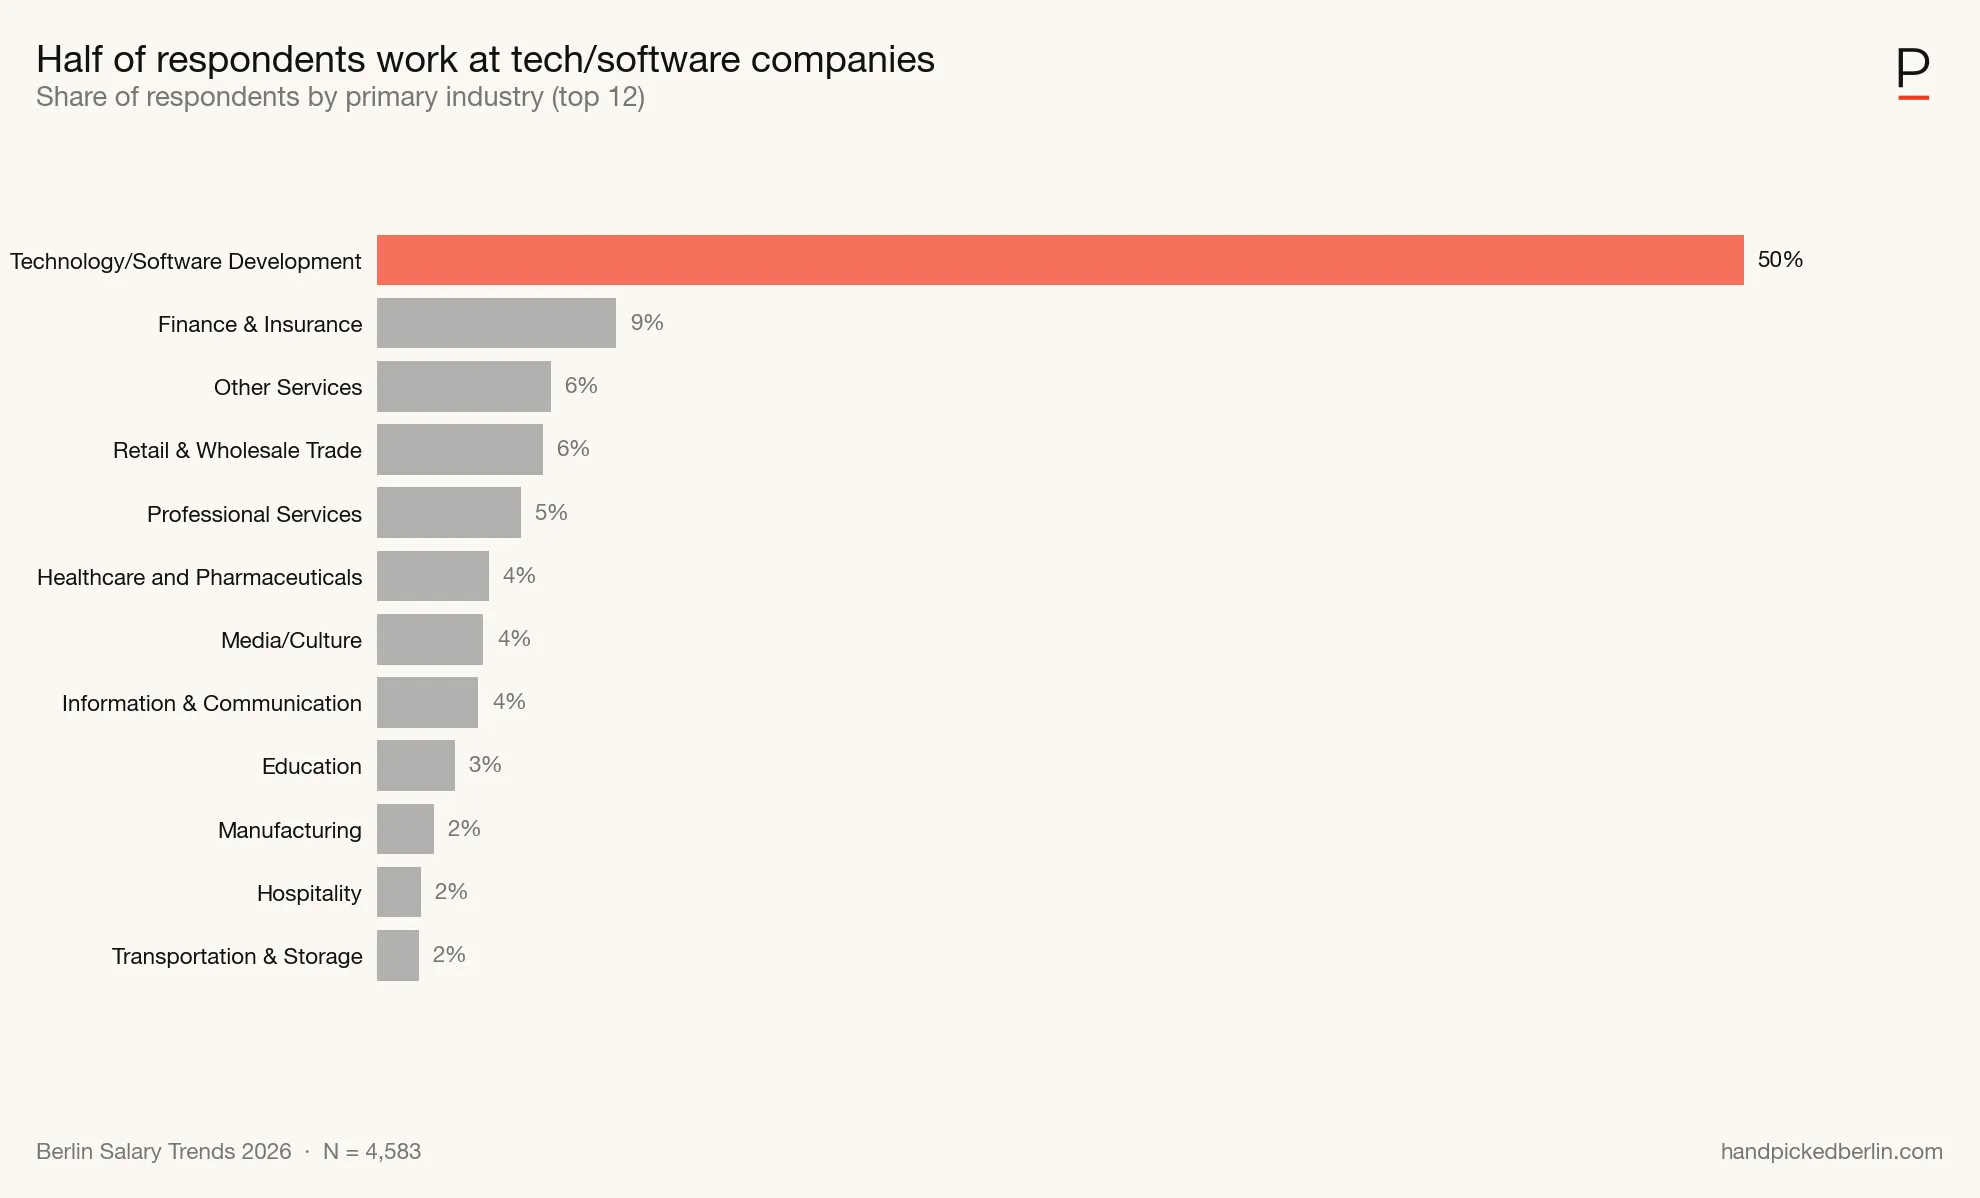
50% work at Tech/Software companies. The other half spreads across Finance & Insurance (8.7%), media, education, healthcare, retail and others — tech-adjacent knowledge work across Berlin’s economy. 89% of respondents are employed full- or part-time in Berlin; the rest split across self-employed/freelance (4.1%), remote for a Berlin company (3.4%), and recently unemployed (3.5%).
Individual contributors dominate at 71%, with about 24% in manager, team lead, or above roles — the full leadership tier breakdown is in the table below. Education skews high: 54% hold at least a Master’s degree, with another 3.8% holding PhDs.
The three breakdowns below are drawn from the full n=4,627 cleaned sample. Base-n varies per dimension because “prefer not to say” and missing responses are excluded. Work arrangement (fully remote / hybrid / on-site) is covered in How many days are people in the office? and not repeated here.
Leadership level
| Level | n | % |
|---|---|---|
| Individual Contributor | 3,237 | 71.1% |
| Team Lead / Manager | 721 | 15.8% |
| Senior leadership (Senior Manager+ through VP) | 347 | 7.6% |
| C-Suite / Founder | 93 | 2.0% |
| Freelance / Contractor | 152 | 3.3% |
Base: n=4,550 (excludes 34 prefer-not-to-say + 43 missing).
Company size (employees, global)
| Band | n | % |
|---|---|---|
| 1–10 | 199 | 4.6% |
| 11–50 | 636 | 14.5% |
| 51–200 | 806 | 18.4% |
| 201–500 | 611 | 14.0% |
| 501–1,000 | 465 | 10.6% |
| 1,000+ | 1,654 | 37.8% |
Base: n=4,371 (excludes 45 prefer-not-to-say + 211 missing).
Department
Full workforce composition by department — with salary cuts — is covered in the Company Benchmark report.
How common are raises?
45% of respondents got no raise in the past year, and another 37% got just 1–5% — meaning roughly four-fifths of Berlin tech either lost ground to inflation or barely kept pace.
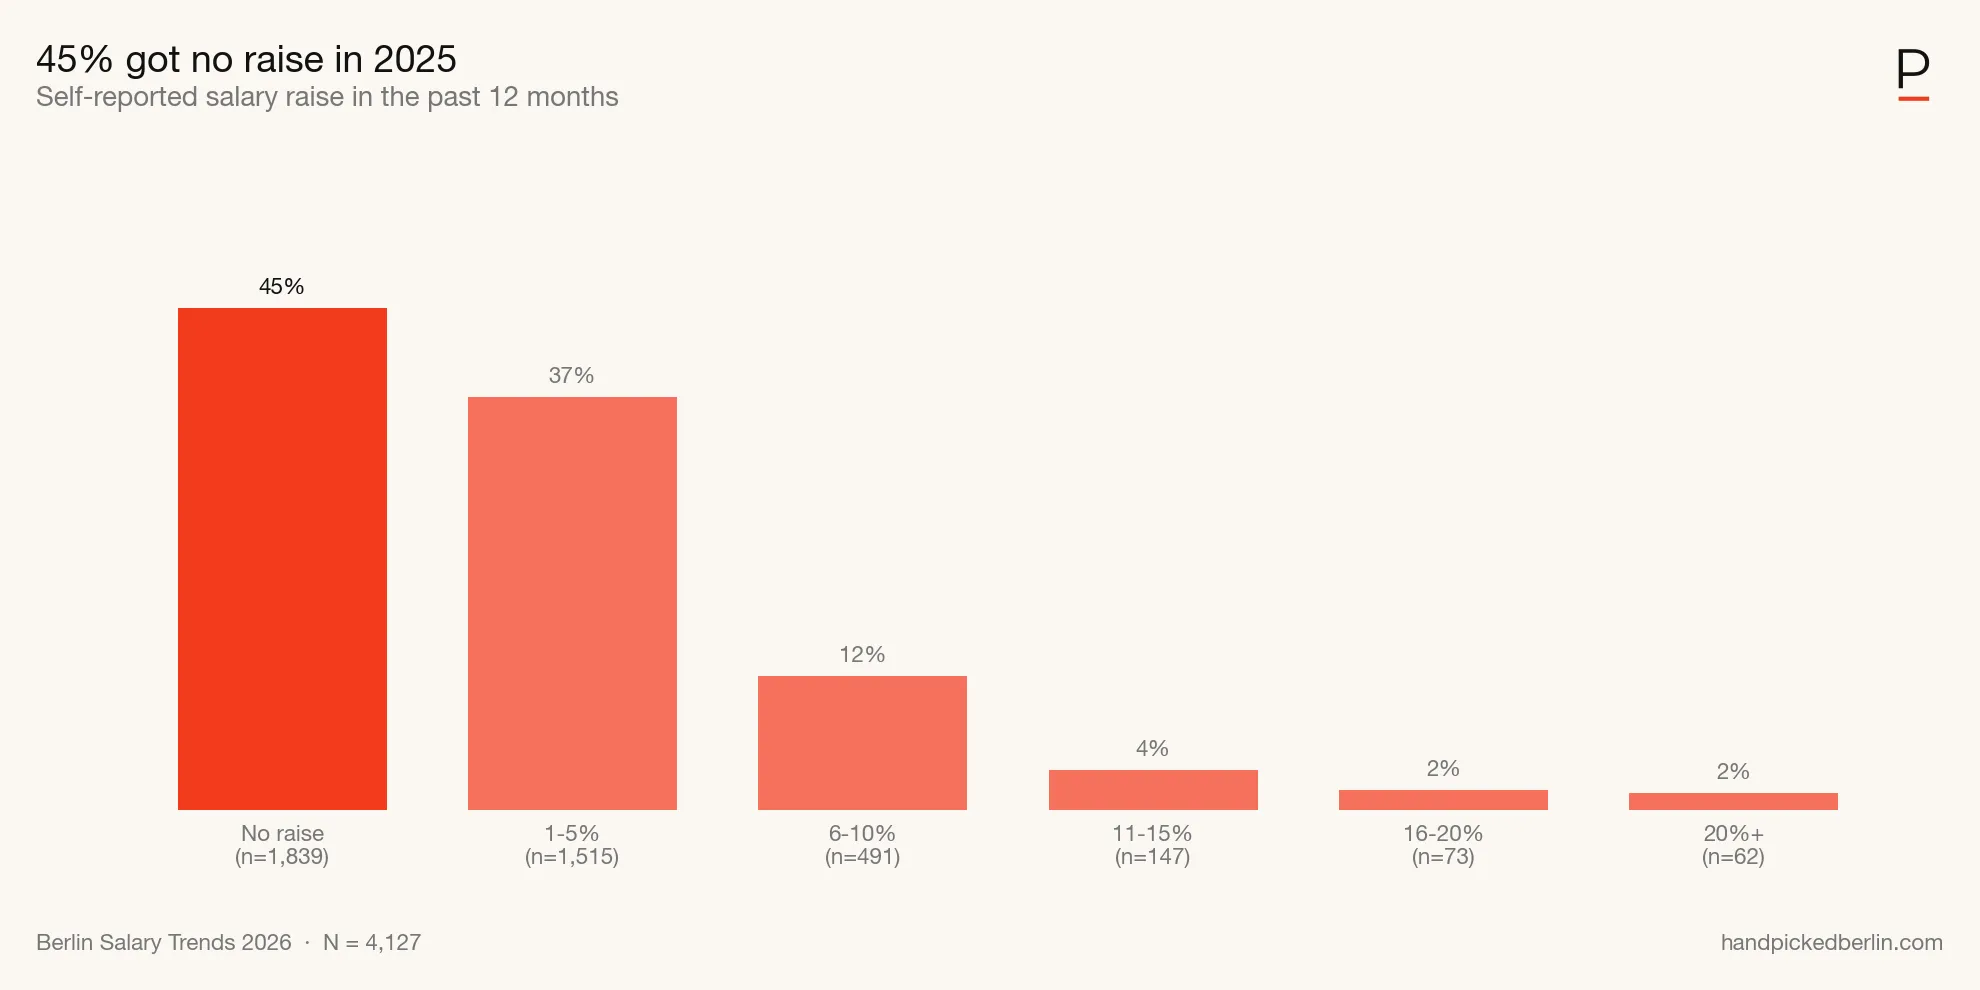
Only 7% received a raise of 11% or more. Combine that with the 33.0% planning to switch jobs and the 45.2% naming compensation as their top driver, and the picture is a market where staying put has been a worse pay strategy than moving.
How common are bonuses, equity, and paid overtime?
Bonuses and equity are minority benefits in Berlin tech: most workers don’t get them. The bigger flag is overtime. 41% report doing overtime that’s expected but uncompensated, this means no cash, no time off in lieu (TOIL) or flex-time.
Another 25% bank their overtime as time off, and just 7.0% get paid for it. For a market where the legal default is overtime compensation, that’s a lot of people working for free.
The direct survey question shows 41.0% of respondents receive an annual bonus and 26.8% hold equity, VSOP, or ESOP (bases n=3,532 and n=3,303 — excluding “prefer not to say” and missing answers). These numbers differ from the 31% / 35% quoted later in the benefits section, which come from a separate multi-select benefits question (n=4,214, Q29).
The benefits checklist tends to under-count bonuses (people don’t always think of variable pay as a “benefit”) and over-count equity (it captures anyone offered VSOP, including unvested or symbolic grants). The numbers here are the cleaner “do you actually get this?” signal.
Overtime compensation
| Status | n | % |
|---|---|---|
| No — overtime expected but not compensated | 1,789 | 40.9% |
| Yes — additional time off (TOIL / flex-time) | 1,086 | 24.8% |
| Not applicable | 1,137 | 26.0% |
| Yes — paid overtime | 305 | 7.0% |
| Prefer not to say | 55 | 1.3% |
Base: n=4,372 (excludes 255 missing).
Did you negotiate your salary?
42.4% didn’t negotiate. Another 10.4% answered “not applicable” — a catch-all that likely bundles fixed pay grades (public sector, collective bargaining) and respondents without a negotiation opportunity yet. Of the 47% who did negotiate, just over a third got the full ask, the rest got less or were declined outright. Detailed splits (who negotiates, who succeeds, by gender and role) sit in the paid reports.
What are the most common benefits in Berlin tech?
The standouts: remote work from abroad (2+ weeks/year) at 59% is now the most common non-cash benefit in Berlin tech, more common than equity (35%), bonuses (31%), or sabbatical options (27%).
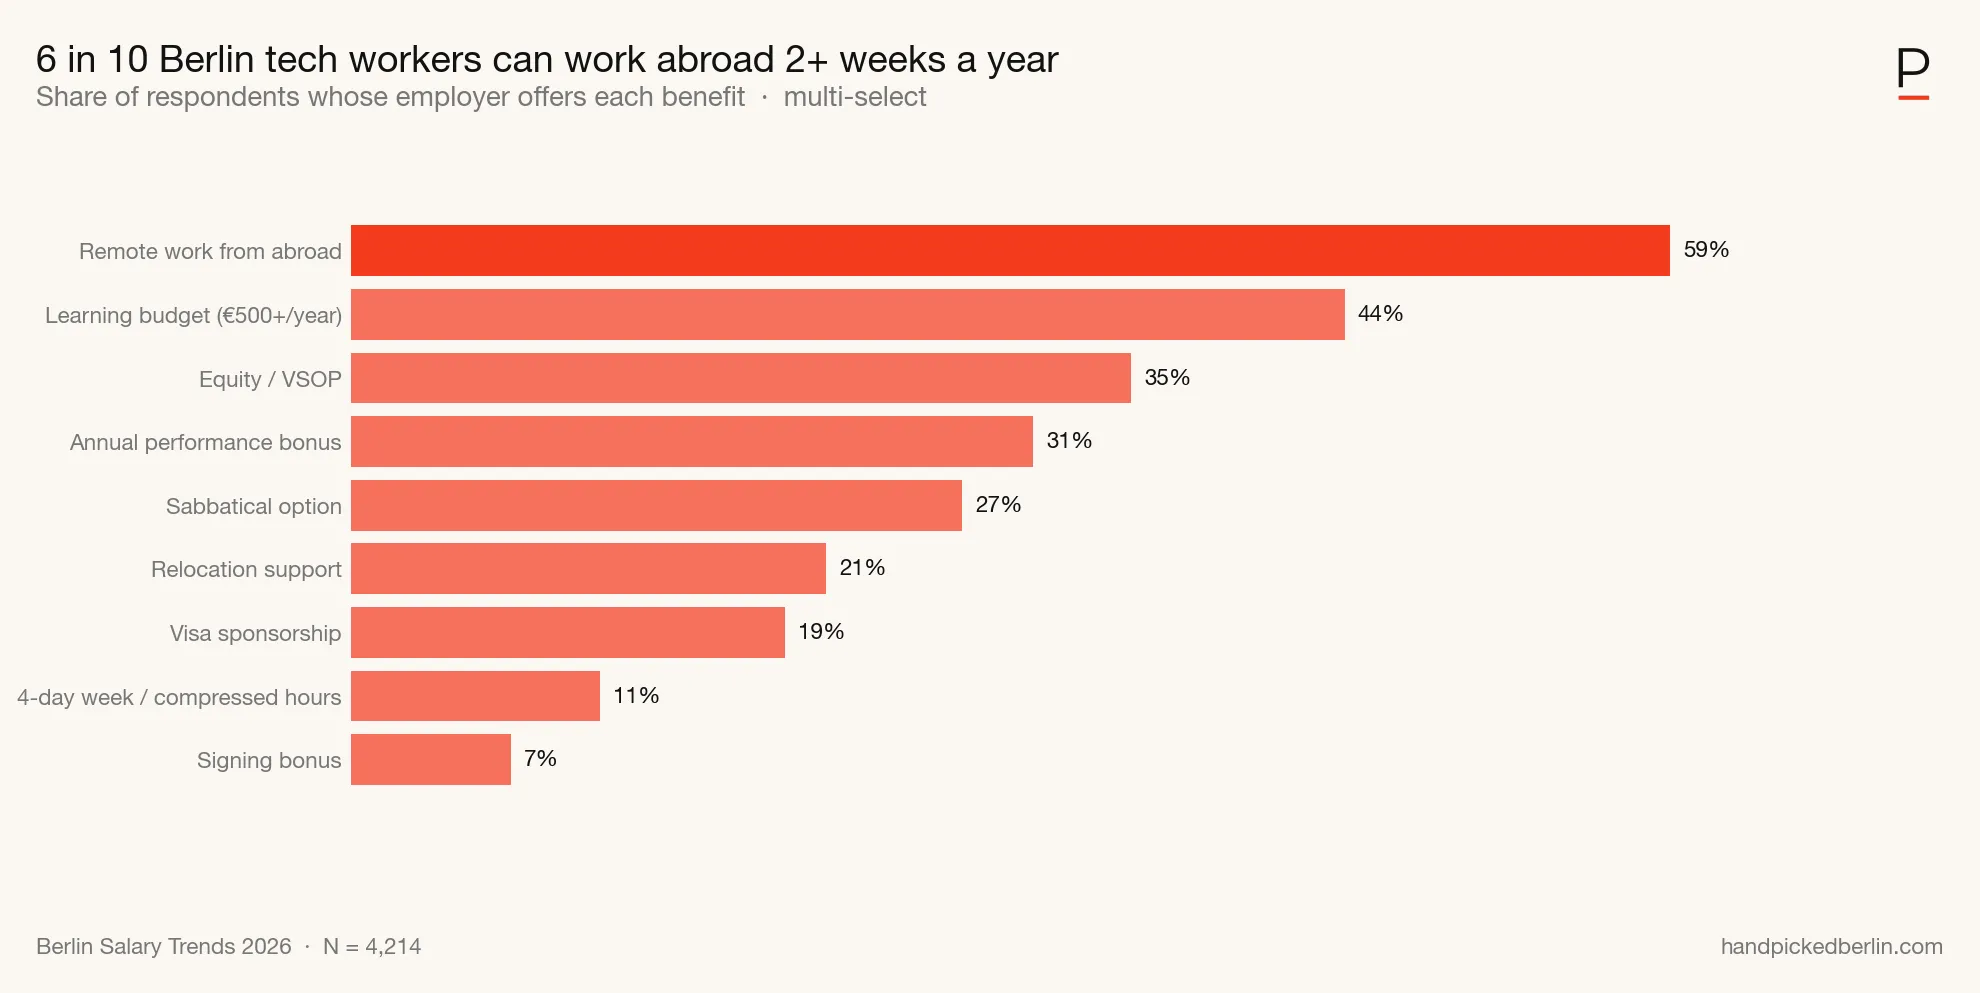
A learning budget of €500+ sits at 44%. The rare-but-notable end: 4-day work weeks or compressed hours (11%) and signing bonuses (7%) — both still niche but worth tracking. Visa sponsorship sits at 19%.
See benefits by company size and industry, or what’s standard for your role.
You’ve made it to the end and that’s a lot of Berlin tech data in one sitting. If this is the kind of thing you want more of, the newsletter comes in two editions every week: Handpicked Berlin on Monday (news, tech, business, culture) and Handpicked Careers on Thursday (jobs, hiring, startups, and community).
Frequently asked questions
What is the average tech salary in Berlin in 2026?
The average gross annual salary for full-time employees is €83,949, up 3.5% from €81,072 in 2025. The median is €80,000. Use the median as a reference — the average is pulled up by a small group of high earners. (2025 anchors are recomputed on the FT subset of last year’s data; the published 2025 headline of €78,574 was on a mixed population and isn’t directly comparable.)
What is the median salary for tech workers in 2026?
€80,000 — up 4.6% from €76,500 in 2025, based on 4,138 full-time employees. (2025 anchor is recomputed on last year’s FT subset; the published €75,000 mixed-population figure isn’t directly comparable.)
How much does experience increase earnings?
Substantially in the first decade, then more slowly. Median pay rises from €64,000 at 3–5 years to €80,000 at 6–10 years, €92,700 at 11–15 years, and €97,000 at 16+ years. The biggest single jump is between 3–5 and 6–10 years.
Which tech roles have the highest salaries?
Engineering Leadership (€115,000), Legal & Compliance (€99,000), and AI & Machine Learning Engineering (€95,000) lead at the median.
What industries offer the best compensation?
Tech/Software (€85,000) and Finance & Insurance (€84,000) lead. Hospitality (€57,000), Media/Culture (€60,000), Education (€62,450), and Public Administration (€62,600) sit at the bottom.
How large is the gender pay gap in Berlin tech?
The raw gap is 17.6% (women €70,000 vs men €85,000) — a slight narrowing from 2025. The 2026 controlled gap (OLS, adjusting for experience, role family, seniority, and company size) is 6.6%, down from 14.9% in 2025.
Does German language proficiency affect compensation?
Not in the direction most people expect. C2/native German speakers earn a lower median (€75,000) than A1 beginners (€82,500) — this reflects role and industry composition, not German fluency dragging down salary.
Do startups pay more or less than established companies?
At the median, base pay is essentially equal (€80,000 at startups vs €79,000 at established companies — a 1.3% gap). The real difference is in equity, which is concentrated at startups.
How does company size affect salary?
A clear premium for size: €65,000 median at 1–10 employee companies vs €85,000 at 1,000+ — a 31% gap.
Does citizenship affect earnings?
Non-EU passport holders earn slightly more at the median (€80,000) than German (€78,000) and other-EU citizens (€75,000), a pattern most plausibly explained by visa-sponsorship roles concentrating in higher-paid technical positions.
What percentage of tech workers plan to change jobs?
33.0% are likely or very likely to change jobs in 2026 — up ~2pp vs 2025’s 30.82%.
How common are bonuses and equity compensation?
Two survey questions give two views. The benefits multi-select (Q29, n=4,214) shows 31% ticking “annual bonus” and 35% ticking “equity or stock options”. The direct yes/no question shows 41.0% receive a bonus (n=3,532) and 26.8% hold equity (n=3,303). The direct question is the cleaner “do you actually get this?” signal; the checklist tends to under-count bonuses and over-count equity. Either way, both are minority benefits.
What is the educational background of most tech workers?
54% hold at least a Master’s degree, including 3.8% with a PhD.
How does education level affect earning potential?
Modestly. Bachelor’s and Master’s medians are essentially tied (€80,000 vs €79,200); PhDs earn a €5,000–6,000 premium (€85,000).
What share of Berlin tech workers are full-time vs part-time or freelance?
4.8% of respondents work part-time, 4.1% are self-employed or freelance, and the rest are full-time employees.
How common are raises in Berlin tech?
45% of respondents received no raise in the past year. Among those who did, the most common bracket was 1–5%.
How many Berlin tech workers negotiate their salary?
Roughly half (47% overall) of respondents negotiated their current salary or most recent raise. The split by gender is close: 49% of women and 46% of men.
Is overtime paid in Berlin tech?
Of those who work overtime, 41% receive no compensation for it — no extra pay, no time off in lieu.
How much does a software engineer earn in Berlin?
General software engineers earn a median of €88,000; engineering leadership €115,000. For breakdowns by seniority, company size, and experience, see the role report.
How much do AI engineers earn in Berlin?
AI & Machine Learning engineers earn a median of €95,000 (n=43) — third-highest among role families in 2026, behind only Engineering Leadership and Legal & Compliance. AI & ML Engineering is a newly broken-out role family this year as the audience grew large enough to report on separately.
How do Berlin tech salaries compare to the rest of Europe?
Berlin tracks at or above the European median across most levels. Using Ravio’s level-aligned benchmarks: Berlin executives €156,100 vs Europe €151,110; Berlin managers €100,300 vs €88,895; Berlin professionals €73,000 vs €63,100. Berlin employees earn at the top end compared to Europe.
Are Berlin tech salaries gross or net?
Every salary figure in this report is gross annual salary (before tax and social contributions). Take-home pay in Germany varies significantly by tax class, marital status, church-tax status, and health insurance choice — typically 55–65% of gross for tech-band salaries.
How satisfied are tech workers with their compensation?
The mean satisfaction score is 3.0 / 5 — exactly in the middle. 34% score their salary 1–2; 37% score it 4–5.
Does the gender pay gap remain after adjusting for experience and role?
Yes. After adjusting for experience, role family, seniority, and company size in an OLS regression, the 2026 controlled gap is 6.6% (n=3,955, p<0.001) — meaning women earn ~6.6% less than men in equivalent positions. A like-for-like re-run of 2025’s weighted-bin method on 2026 data gives 7.6%. See the gender pay gap methodology for the full specification.
How common is remote work in Berlin tech?
22% of respondents are fully remote, around 50% are hybrid (1–3 office days per week), and only 17% spend 4+ days in the office. Hybrid is the dominant model.
What would happen if companies mandated return-to-office?
68.8% of at-risk Berlin tech workers (those not already fully on-site or fully remote) would either leave within six months or start actively job-hunting if their employer mandated 4+ office days per week. n=3,615.
What are the most common employee benefits in Berlin tech?
Top three: remote work from abroad 2+ weeks/year (59%), learning budget €500+ (44%), and equity/VSOP (35%). (Base: 4,214 employed respondents who saw Q29; excludes self-employed and pre-page-6 drop-offs.)
Do Berlin tech jobs offer relocation support?
21% of respondents receive relocation support and 19% are sponsored for a visa. Both numbers reflect the international hiring profile of Berlin tech, where roughly four in five workers hold a non-German passport.
Are tech workers worried about AI?
61.2% are concerned about AI affecting their job security — yet 87.5% use AI tools personally and 84.7% report it has made them more productive.
Notes on methodology and data cleaning
Data collection: The survey ran in March 2026 via Tally, in English and German. German responses were translated and merged with the English dataset.
Sample: 4,627 total submissions after cleaning. Of those, 4,138 carry the full-time salary data used in pay analyses.
Cleaning rules:
- Disqualified respondents (working students, non-Berlin) were screened out at Q1 and never reached the rest of the survey
- Salary validation: automated range checks (€10,000–€500,000) + manual review of flagged entries (including job titles, which is the only free text field in the survey)
Salary scope: All salary figures are gross annual salary for full-time employees. Part-time respondents (4.8% of the sample) are excluded from salary analyses but included in all demographic and non-salary sections.
Year-over-year comparability: All 2025 salary anchors used for YoY deltas in this report are recomputed on the full-time subset of the 2025 dataset (n=1,700) — €76,500 median, €81,072 average. The published 2025 headline figures (€75,000 median, €78,574 average) were computed on a mixed population that included part-time and contract workers, so they understate the FT-only equivalents and aren’t directly comparable to the 2026 numbers. The 2026 edition uses the FT-only basis throughout.
Cross-analysis thresholds: Minimum n = 30 for any published data point. Where subgroups fall below this threshold, categories are collapsed or the analysis is omitted.
Dataset skew: Roughly 36% of respondents are in engineering and technical roles — software engineering (all SWE families: leadership, general, cloud/DevOps, frontend, QA), AI & ML engineering, data roles (engineering, science, analytics, specialised analytics), and system/IT administration. UX research is not counted. German-only citizens account for 21%. 59% are male. These patterns are consistent with prior years.
Job title classification: Job titles were classified into role families using a combination of automated keyword matching against a maintained job-title map and manual review for unmatched entries. The full mapping is published alongside the dataset for transparency.
Role-report bundling: Throughout this free report (including the Which roles pay the most and least? chart) we use raw job families — Engineering Leadership, AI & ML Engineering, Software Engineering, and so on. The paid per-role PDFs bundle related families into 18 broader role reports. The table below shows which raw job families make up each paid role report, with full-time n per family in parentheses. AI & Machine Learning Engineering appears both inside Data & Analytics and as its own standalone AI & ML Engineering report — the family is counted in both rows, but respondents are not double-counted in the dataset.
Role report → job family mapping
| Role report | Job families bundled | n (full-time) |
|---|---|---|
| Software Engineering | SWE - General Software Engineering (740) SWE - Cloud & DevOps (48) SWE - Quality Assurance (42) SWE - Frontend Engineering (32) SWE - Backend Engineering (29) SWE - Full Stack Engineering (28) SWE - Solutions Architecture (21) SWE - Mobile Engineering (17) SWE - SRE & Infrastructure (15) SWE - Web Development (1) | 973 |
| Product Management | Product Management (427) | 427 |
| Data & Analytics | Data Analytics (159) Data Engineering (73) Data Science (71) Specialized Analytics (46) AI & Machine Learning Engineering (43) Business Analytics (16) | 408 |
| Marketing | Marketing - Leadership & Management (174) Marketing - Brand & Communications (62) Marketing - Content & Creative (50) Marketing - Digital & Performance (48) Marketing - Operations & Analytics (24) Marketing - Community & Events (17) | 375 |
| Product Design & UX Research | Product Design (190) UX Research (32) | 222 |
| Engineering Leadership | SWE - Engineering Leadership (216) | 216 |
| HR & People | HR - Leadership & Management (83) HR - Talent Acquisition & Management (66) HR - Learning, Development & Culture (16) HR - Business Partners & Relations (16) HR - People Operations & Administration (16) | 197 |
| Sales, Account Management & Customer Success | Sales (115) Account Management (38) Customer Success (38) | 191 |
| Project & Program Management | Project Management & Coordination (161) Program Management (29) | 190 |
| Operations | Operations - Leadership & Management (114) Operations - Functional (42) Operations - Supply Chain & Procurement (28) | 184 |
| Strategy & Business Development | Strategy & Business Development (129) | 129 |
| Finance | Finance (91) Accounting (7) | 98 |
| Consulting | Consulting (83) | 83 |
| System / IT Administration | System / IT Administration (76) | 76 |
| Visual & Graphic Design | Visual & Graphic Design (50) | 50 |
| Research & Science | Research & Science (49) | 49 |
| AI & ML Engineering | AI & Machine Learning Engineering (43) | 43 |
| Legal & Compliance | Legal & Compliance (31) | 31 |
Gender pay gap methodology
Controlled gap (6.6%): Coefficient on the female dummy in an OLS regression of log(annual gross salary) on gender, with categorical controls for experience band, role family, seniority level, and company size. Sample: n=3,955 full-time respondents with complete data across all variables. Female coefficient = −0.068 (HC3 robust SE 0.009, p < 0.001), which converts to a 6.6% pay gap. Model fit: R² = 0.579. Gender is coded Male = 0 (reference), Female = 1; non-binary respondents and “prefer not to say” are excluded, consistent with the raw-gap analysis.
Like-for-like comparison to 2025: Because the 2026 OLS model adds controls that weren’t in 2025’s published figure, we also re-ran the 2025 method on 2026 data — median gap per role × experience cell, weighted by combined male+female headcount, min 5 respondents per cell. That method produces a 2026 gap of 7.6% across 17 cells (n=1,476), against 2025’s published 14.9%. The weighted-bin figure uses a smaller subset than the OLS because it only counts cells where both genders pass the 5-respondent floor — it’s a YoY-comparability tool, not a full-sample headline.
Sampling uncertainty in the YoY comparison: Bootstrap analysis on 2026 data (500 resamples, weighted-bin method) gives a 95% range of approximately 5%–13% at the full 2026 sample (n=4,138). At the smaller 2025-equivalent sample size (n=1,700, SD ~2.5pp) the range widens to ~4%–14%, and the 2025 published value of 14.9% falls in only ~1% of those bootstraps. The simplest reading: the 2025 figure was inflated by small-sample noise. Some real narrowing likely occurred, but materially less than the headline 7.3pp drop suggests.
What the 6.6% does and doesn’t capture. Two caveats run in opposite directions:
- Better controls would shrink it. Specific job title, employer, hours, performance ratings, and prior salary aren’t in the model. Including them would absorb some of the 6.6%, making it a ceiling on the within-job gap.
- The controls we do have aren’t neutral. Role mix and seniority themselves reflect historical bias, not just legitimate productivity differences. So 6.6% is also a floor on the broader discrimination story.
The 6.6% is the residual under a specific set of controls — not a definitive measure of either the within-job gap or total discrimination.